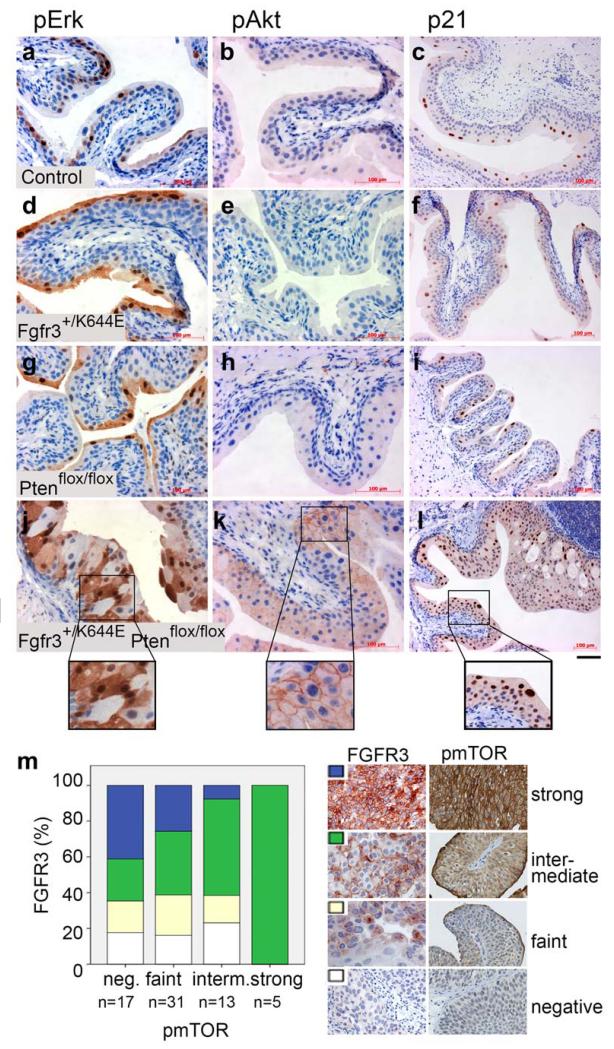
Figure 4. Deregulation of downstream signalling and cell cycle arrest in the UroIICreFgfr3+/K644EPtenflox/flox urothelium.
Immunohistochemistry was performed in Control (a-c), UroIICreFgfr3+/K644E (d-f), UroIICrePtenflox/flox (g-i), and UroIICreFgfr3+/K644EPtenflox/flox urothelia (j-l) with antibodies against phosphorylated Erk1/2 (pErk) (a, d, g, j), phosphorylated Akt (pAkt) (b, e, h, k) and p21 (c, f, i, l). (m) Levels of FGFR3 expression and p-mTOR were semi-quantitatively evaluated in TMA containing T1 urothelial tumours using the 4-point scale (negative, faint, intermediate, strong). Scale bar represents 50 μm in a, b, d, e, g, h, j, k, 100 μm in c, f, i, l, 25 μm in inserts of j-k and 50 μm in insert l.

