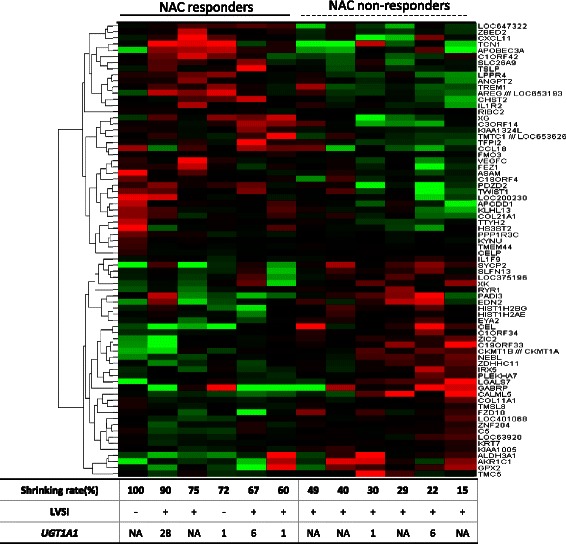
Fig. 1.

Expression pattern of discriminating genes of post-NAC tumors between responders (shrinkage rate ≧50 %) and non-responders (shrinkage rate < 50 %) among 12 LACC patients. The listed genes were extracted by comparative analysis using the SAMROC method with a p-value <0.001. Vertical columns represent individual samples, and the table at the bottom provides data on the shrinkage rate, LVSI, and UGT1A1 polymorphism. Concerning UGT1A1 polymorphism, 1, 6, and NA indicate “UGT1A1 *1/*1 (UGT1A1-wild),” “heterozygotic polymorphism of UGT1A1 *1/*6,” and “not available” respectively
