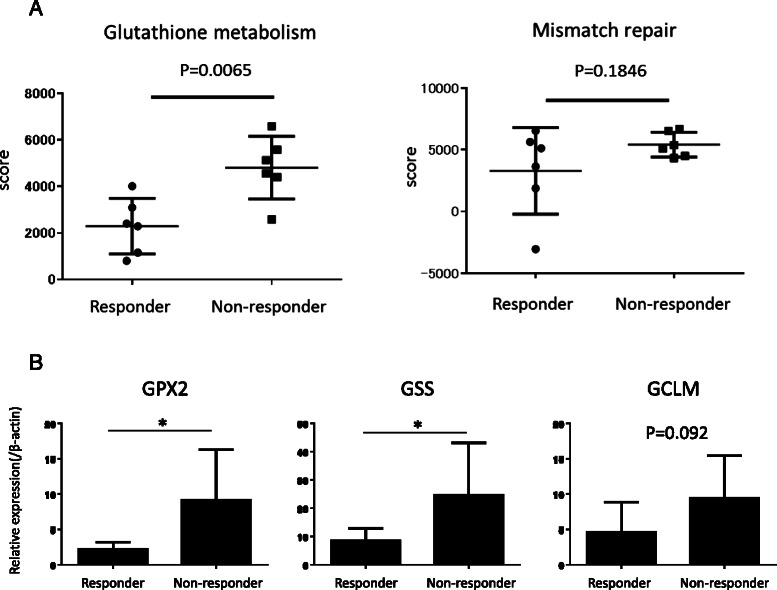
Fig. 2.

a Comparison of ssGSEA scores of glutathione metabolism and mismatch repair pathways between NAC-responders (n = 6) and non-responders (n = 6). The Mann–Whitney U test was used for statistical analysis of the two groups. b Relative expressions of GMP genes, GPX2, GSS, and GCLM, were compared between NAC-responders and non-responders based on quantitative PCR
