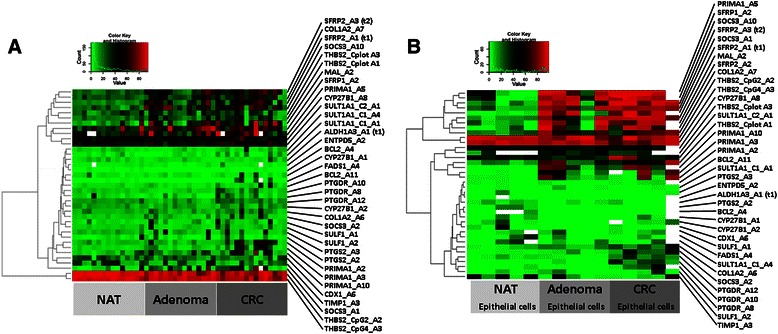
Fig. 3.

Heatmap representing level of DNA methylation in a) NAT, AD, and CRC biopsies and macrodissected samples and in b) NAT, AD and CRC LCM epithelial cells. Intensity values on the colour scale were as follows: red - high intensity, black - intermediate intensity, green - low intensity. Samples are shown in columns, selected genes are in rows. Similar DNA methylation pattern could be found in both sample types, as PRIMA1, SFRP1, SFRP2, MAL, SOCS3, CYP27B1, COL1A2 and SULT1A1 showed relatively high DNA methylation levels in colon biopsies and LCM epithelial cells
