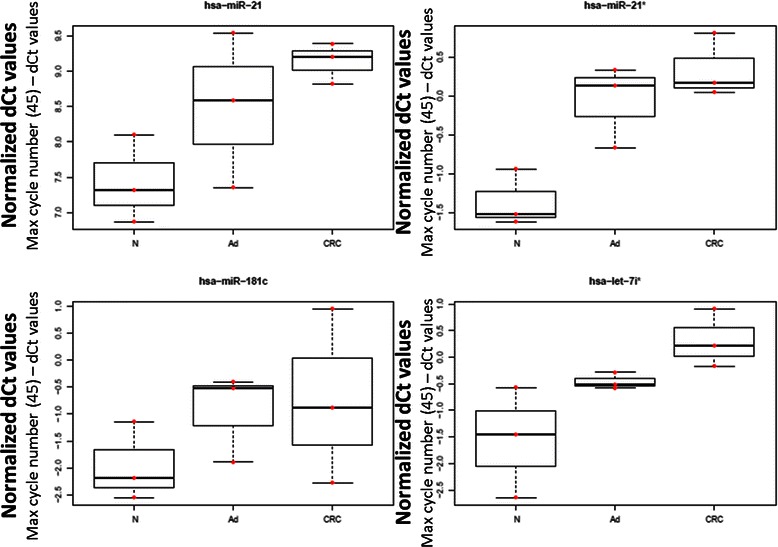
Fig. 4.

Normalised Ct values of selected miRNAs (hsa-miR-21, hsa-miR-21*, hsa-miR-181c, hsa-let-7i*) targeting the selected marker set. Raw Ct data were substracted from the maximal qPCR cycle number (45) and data were normalised with interplate calibrators and also with miR-423-5p Ct values. Red dots represent individual miRNA normalised Ct values, box plots represent median and standard deviation of the data
