Fig. 5.

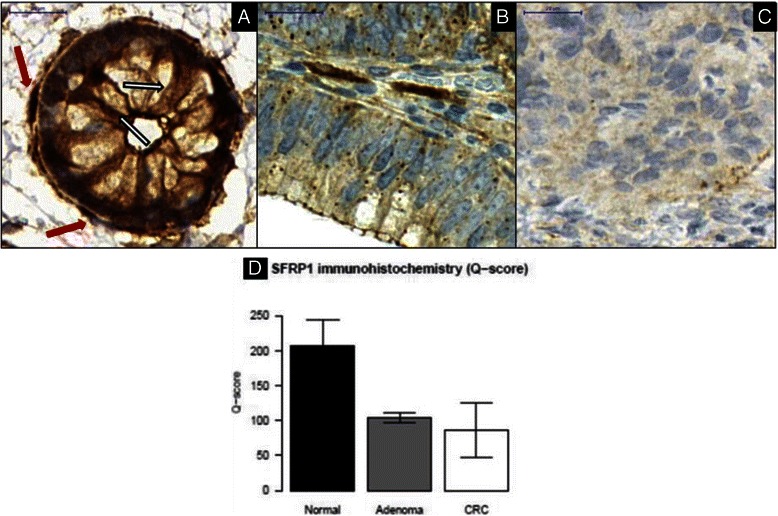
Continuously decreasing SFRP1 protein expression could be observed along colorectal adenoma-carcinoma development in epithelial/CRC compartment of NAT (a), AD (b), and CRC (c) samples. SFRP1 protein expression of healthy epithelial cells (a, white arrows) was compared to that in endogenous myofibroblasts (a, red arrows) with strong (+3) immunopositivity (digital microscopy images, 90x magnification, scale bar: 20 μm). Semiquantitative immunohistochemistry results (Q-score values) of NAT, AD, and CRC specimens are summarised as bar charts with whiskers representing standard deviation (d)
