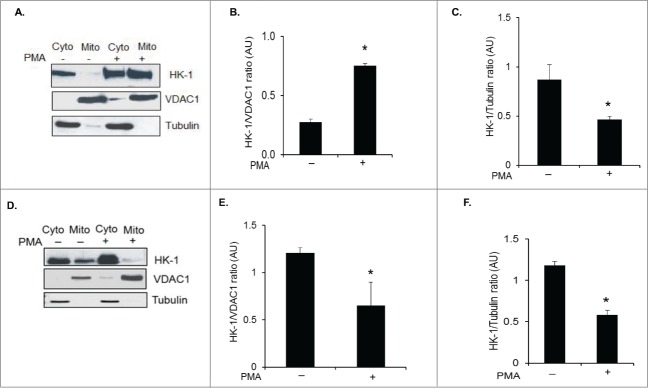
Figure 2.

HIV-1 increases mitochondria bound HK-1 levels in U1 cells. (A) Uninduced (−) and PMA induced (+) U1 cells were harvested after 72 h of induction and fractionated into cytoplasmic and mitochondrial fractions. The cytoplasmic and mitochondrial fractions were analyzed by Western blot for the changes in expression levels of HK-1. VDAC1 and α-tubulin were used as markers for fraction purity and protein loading of mitochondrial and cytoplasmic fractions, respectively. (B) Densitometric analysis of HK-1 expression levels in the mitochondrial fraction normalized to VDAC1 levels in uninduced (−) and induced cells (+), shown as HK-1/VDAC1 ratio on the y-axis in arbitrary unit (AU). * indicates p value < 0.02. (C) Densitometric analysis of HK-1 expression levels in the cytoplasmic fraction normalized to α-tubulin levels in uninduced (-) and induced (+) U1 cells, shown as HK-1/Tubulin ratio on the y-axis in arbitrary unit (AU). * indicates p value < 0.05. (D) Uninduced (-) and PMA induced (+) U937 cells were harvested after 72 h of induction and fractionated into cytoplasmic and mitochondrial fractions. The cytoplasmic and mitochondrial fractions were analyzed by Western blot for the expression of HK-1. VDAC1 and α-tubulin were used as markers for fraction purity and protein loading of mitochondrial and cytoplasmic fractions, respectively. (E) Densitometric analysis of HK-1 expression levels in the mitochondrial fraction normalized to VDAC1 levels in uninduced (-) and induced (+) U937 cells, shown as HK-1/VDAC1 ratio on the y-axis in arbitrary unit (AU). * indicates p value <0.05. (F) Densitometric analysis of HK-1 expression levels in the mitochondrial fraction normalized to α-tubulin levels in uninduced (-) and induced (+) U937 cells, shown as HK-1/Tubulin ratio on the y-axis in arbitrary unit (AU). * indicates p value <0.03.
