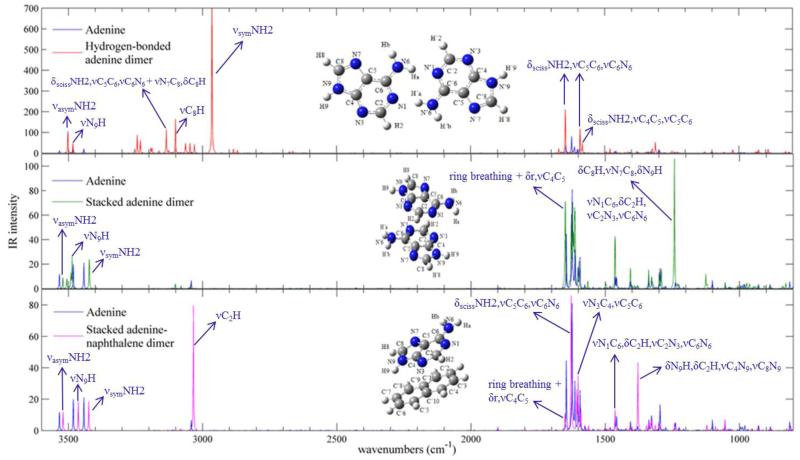
Figure 6.
Anharmonic IR spectra of adenine dimers computed with B3LYP-D3 method, compared with IR spectrum of isolated adenine molecule, in the 800-3600 cm−1 energy range, along with the assignment of most pronounced bands. Theoretical spectra line-shapes have been convoluted with Lorentzian functions with a HWHM of 1 cm−1.

