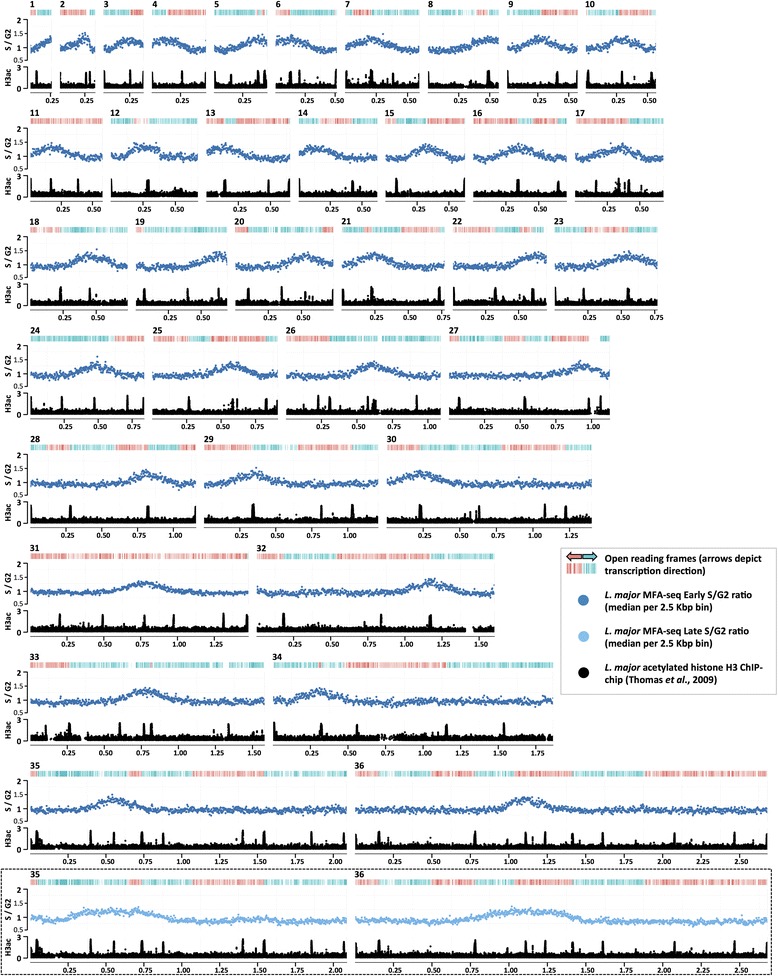
Fig. 1.

Mapping replication origins in the L. major nuclear genome. Graphs show the distribution of replication origins in the 36 chromosomes of L. major (numbered 1–36; sizes denoted in intervals of 0.25 Mb), determined by the extent of enrichment of DNA in S phase relative to G2. For each chromosome, the top track displays coding sequences, with genes transcribed and translated from right to left in red, and from left to right in blue. The graph below shows the ratio of the read depth between early S phase and G2 samples (y-axis), where each dot (dark blue) represents the median S/G2 ratio (y-axis) in a 2.5 Kbp window across the chromosome (x-axis). Finally, the track below the graph displays localization of acetylated histone H3 (H3ac) in each chromosome (data from [6]), identifying positions of transcription start sites (y-axis; values represented as log2). The insert diagram (boxed) shows S/G2 read depth ratio (light blue dots) for chromosomes 35 and 36, as above, but here comparing late S cells with G2. (Late S/G2 MFAseq for all L. major chromosomes is shown in Figure S2 in Additional file 1)
