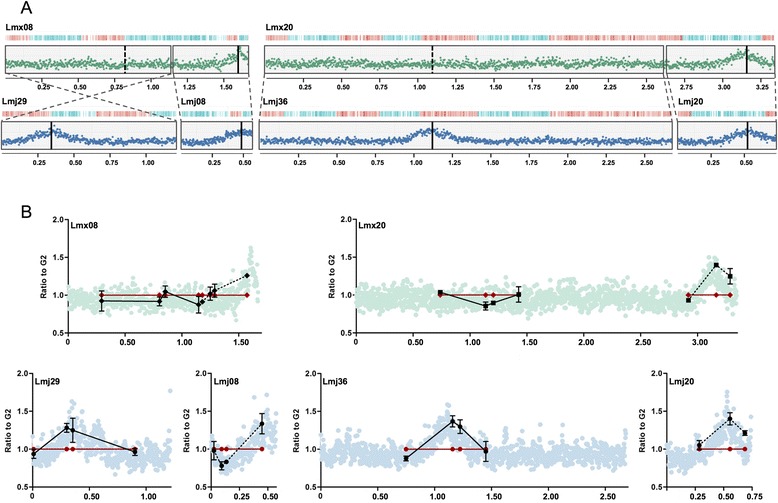
Fig. 2.

Comparing replication origin usage in syntenic L. mexicana and L. major chromosomes that have undergone fusion or fission. a Graphs show replication origin localisation, evaluated by MFAseq, in L. mexicana (Lmx) chromosomes 8 and 20, which are syntenic with L. major (Lmj) chromosomes 29 and 8 and chromosomes 36 and 20, respectively (chromosome sizes are denoted in 0.25 Mb intervals). Blocks of synteny are boxed and their relative orientation indicated; the representation of early S/G2 DNA sequence read depth ratios (L. mexicana green, L. major blue) and coding sequence organisation are as detailed in Fig. 1 and the approximate location of the origin or syntenic non-origin loci is shown by solid vertical lines and dotted vertical lines, respectively. (Figures S4 and S5 in Additional file 1 show MFAseq for all L. mexicana chromosomes and a genome-wide comparison with L. major.) b Validation of replication origin activity in the L. mexicana and L. major chromosomes (shown in (a)) by quantitative PCR, which was performed at a number of loci predicted to display origin activity in L. major and syntenic with L. mexicana. At each locus the relative quantity of S phase (black) and G2 phase (red) DNA is shown: G2 values at each loci are set at 1, and the S phase samples are shown as a proportion of that value (vertical lines indicate standard deviation from at least three experimental repeats); for comparison, the MFAseq data (from (a)) is shown in the background, and the right-hand synteny regions are distinguished from the left hand regions using dotted lines and solid lines, respectively. Positions of the quantitative PCR loci in each chromosome are shown in megabases (x-axes)
