Fig. 3.

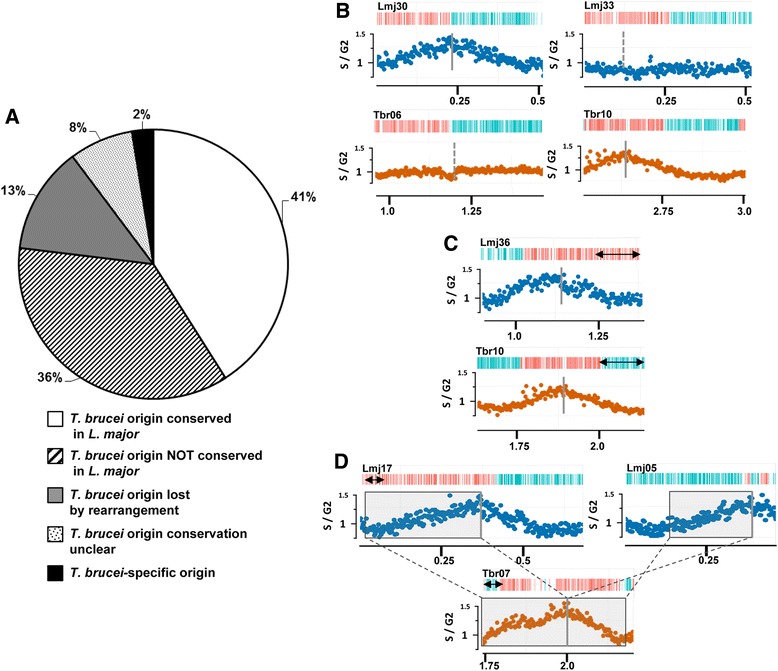
Conservation of DNA replication origins between L. major and T. brucei. a A pie chart showing the proportion of origins mapped in the genome of T. brucei whose locations are either conserved or not in the genome of L. major, based on whole-genome synteny block comparisons (Figure S6 in Additional file 1). White indicates mapped origins in both T. brucei and L. major within regions of conserved gene synteny; stripes indicate mapped T. brucei origins within regions of gene synteny in L .major, but where no origin activity is mapped in the latter; grey indicates T. brucei origins at sites of rearrangement relative to L. major, where synteny is lost; dots depict T. brucei origins in regions of synteny with L. major, but where local rearrangements mean origin conservation is unclear; black represents the single T. brucei-specific origin, found in the subtelomere of chromosome 6, which shows no synteny with L. major. b Synteny conservation between L. major (Lmj) chromosomes 30 and 33, and T. brucei (Tbr) chromosomes 6 and 10, respectively, where origin activity is seen in only one of the parasite chromosomes; S/G2 DNA sequence depth ratios (L. major blue, T. brucei orange) and coding sequence organisation are as detailed in Fig. 1; locations of the regions within the chromosomes are shown in megabases, and the approximate location of the origin or syntenic non-origin loci shown by solid vertical lines and dotted vertical lines, respectively; double-headed arrows denote local rearrangements. c An example of a syntenic region between L. major chromosome 36 and T. brucei chromosome 10 where replication origin activity is conserved. d An example of complex origin conservation: a region of T. brucei chromosome 7 is shown in which a single origin appears to be conserved as two origins in L. major (one origin in two chromosomes: 17 and 5). Synteny blocks are boxed and their relative orientation indicated
