
Fig. 3.
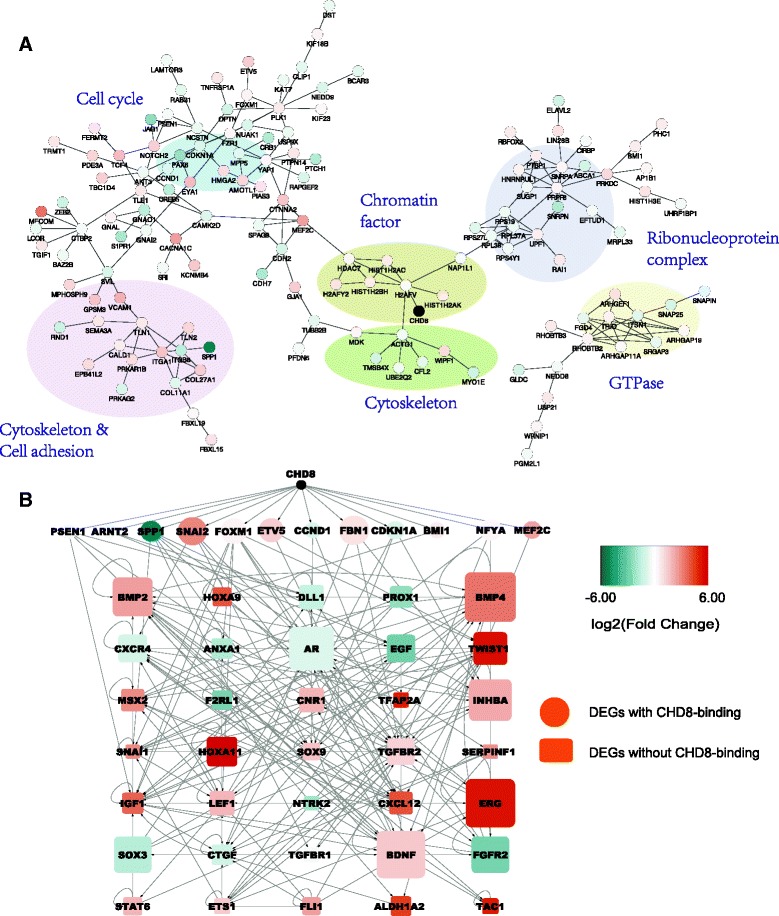
Interaction network of CHD8 direct targets and a putative CHD8 regulatory network in NPCs. a Functional interaction network generated by the STRING database for CHD8 direct targets, with nodes representing genes and edges representing interactions. Colors of the nodes indicate expression changes. Disconnected genes were not shown. b A putative regulatory network connecting CHD8 to a set of upstream regulators, which in turn could regulate the expression of many genes indirectly targeted by CHD8. The edges represent regulatory relationship predicted by the IPA for upstream regulators that were bound (ellipse) or not bound (rectangle) by CHD8. Colors of the nodes indicate expression changes. Sizes of the nodes show the –log10 (p value) from IPA. Arrows start from an upstream regulator to its targets. Note that only differentially expressed upstream regulators were included in the network