
Fig. 8.
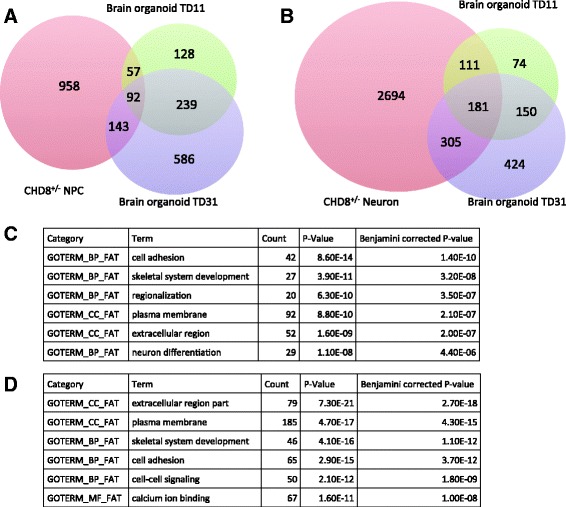
Comparison of DEGs from CHD8 +/− and DEGs from brain ASD organoids [76]. Venn diagrams of DEGs from CHD8 +/− NPCs (a) or neurons (b) and DEGs from brain organoids. The number in each section represents genes that are also expressed in our samples. Top-enriched GO terms for overlapped genes between DEGs from CHD8 +/− NPCs (c) or neurons (d) and DEGs from brain organoids referred to as TD11 and TD31