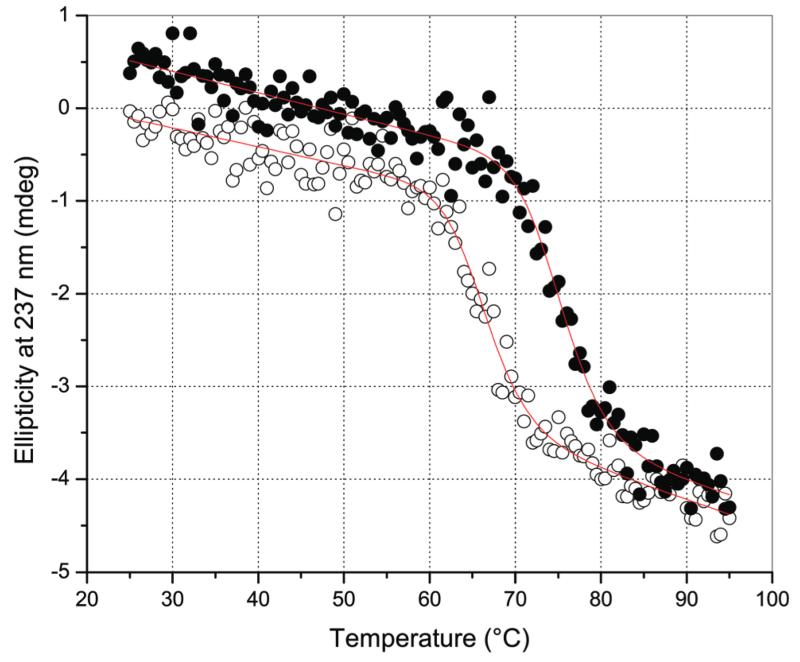
Figure 5.
Thermal denaturation of cAb-HuL5 and cAb-HuL5G monitored by far UV-CD spectroscopy. Ellipticity at 237 nm measured as a function of temperature T (°C) for cAb-HuL5 (open circles) and cAb-HuL5G (filled black circles) after subtraction of the buffer signal. The red solid lines represent a nonlinear least-squares fit to the data using a two-state denaturation model described by eq 1.

