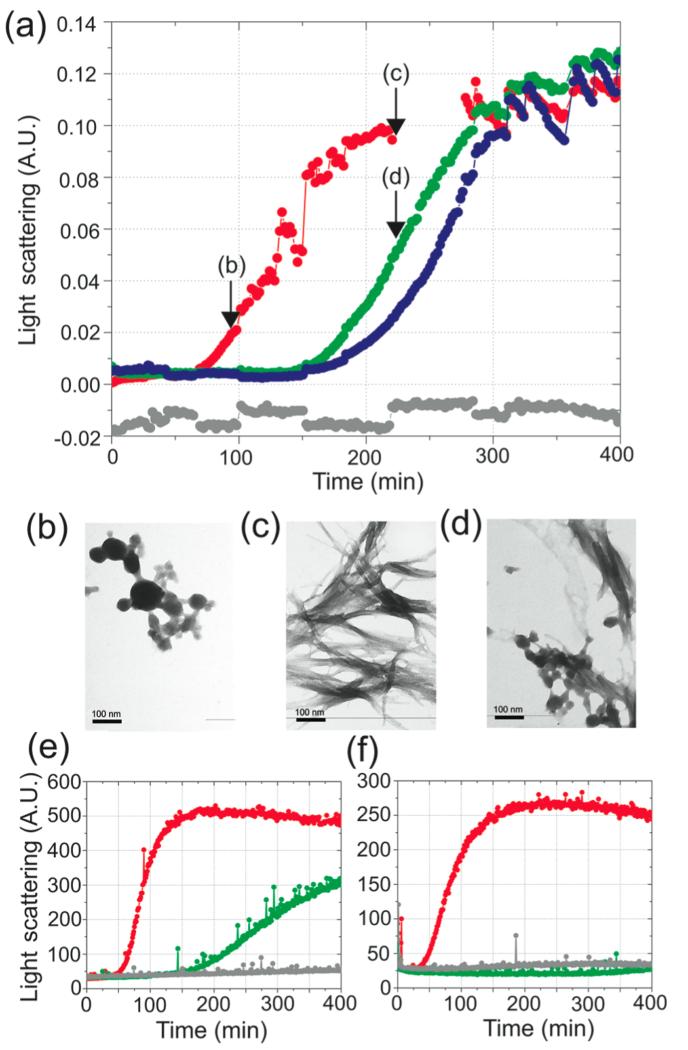
Figure 6.
Fibril formation by the D67H lysozyme variant in the absence and presence of cAb-HuL5G. (a) Time course of the aggregation in 0.1 M sodium citrate buffer pH 5.5 containing 3M urea at 48 °C with stirring of the D67H variant at 6.8 μM in the absence (red) and the presence of 1 equiv (green) and 2 equiv (blue) of cAb-HuL5G. The trace corresponding to the cAb-HuL5G alone and at a concentration that is equivalent to a 2-fold molar excess of the complex is shown in gray. Light scattering at 430 nm was recorded using a UV–visible spectrophotometer with a slit width of 5 nm. Arrows on the plot indicate the time points when samples were taken for TEM analysis. (b–d) TEM images of the aggregation reaction of (b) the D67H variant at 98 min, (c) the D67H variant at 220 min, and (d) the cAb-HuL5/D67H complex at 220 min. The scale bar representing 100 nm is shown in each panel. (e, f) Time course of the aggregation reactions of D67H at 3.4 μM (e) and 1.24 μM (f), respectively, in the presence of 14 μM cAb-HuL5G, resulting in the ratios 1:4 and 1:11.2 of D67H:cAb-HuL5G. The aggregation trace for the D67H variant alone is shown in red, and the trace corresponding to the D67H variant in the presence of cAb-HuL5G is shown in green. The traces for the cAb-HuL5G alone are shown in gray. Light scattering at 430 nm was recorded using a Cary eclipse fluorimeter with excitation and emission slit width of 5 nm.

