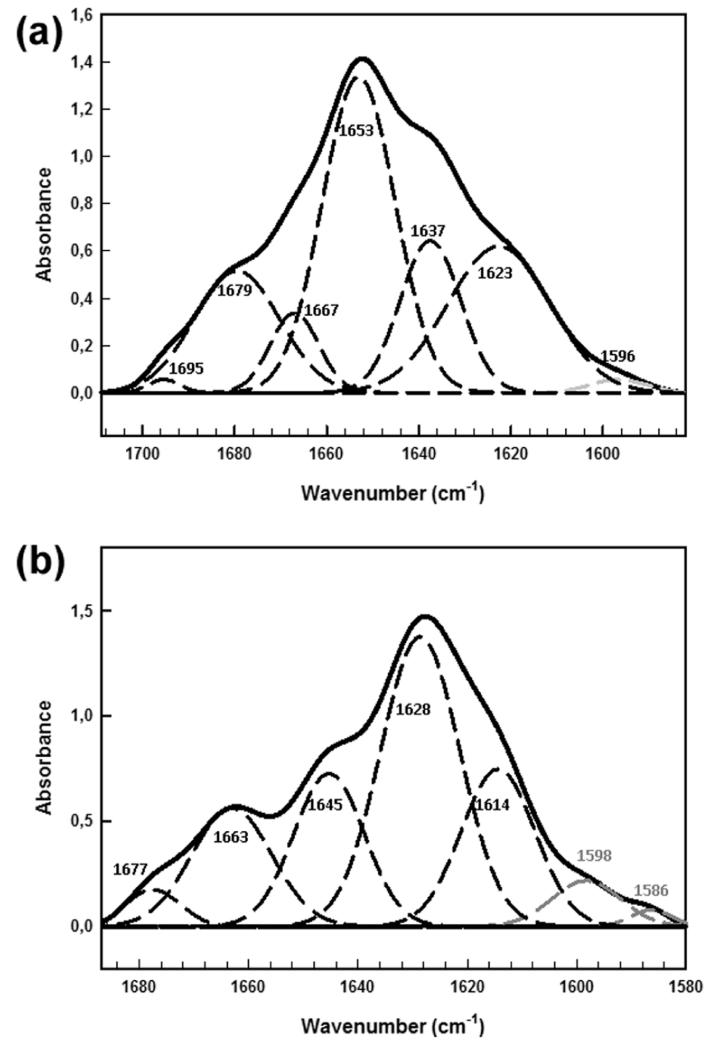
Figure 7.
Fourier deconvoluted and fitted IR spectra in the amide I region with component peaks of (a) the native state of the D67H lysozyme variant and (b) fibrils of the D67H variant measured both at pH 5.5 and 25 °C. The ATR-FTIR spectra are reported as thick lines, whereas the dashed lines correspond to the individual components obtained by curve fitting. Within the fitted spectra, the black lines are assigned to signals corresponding to the main chain and the gray lines are assigned to signals corresponding to the side chains.

