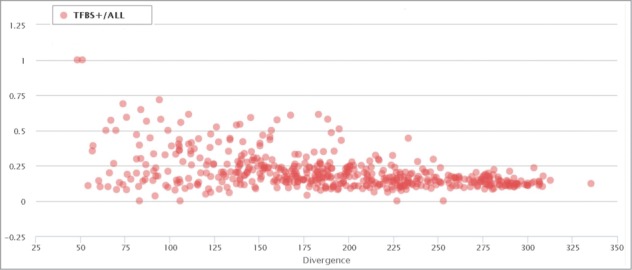
Figure 4.

Proportion of TFBS-containing elements in correlation with the divergence of each ERV/LR family from their consensus sequences. Each data point represents a separate ERV/LR family. “TFBS+/all” means RT+. The divergence is shown as a millidiv score, with each unit equal to one substitution per 1000 nucleotides.
