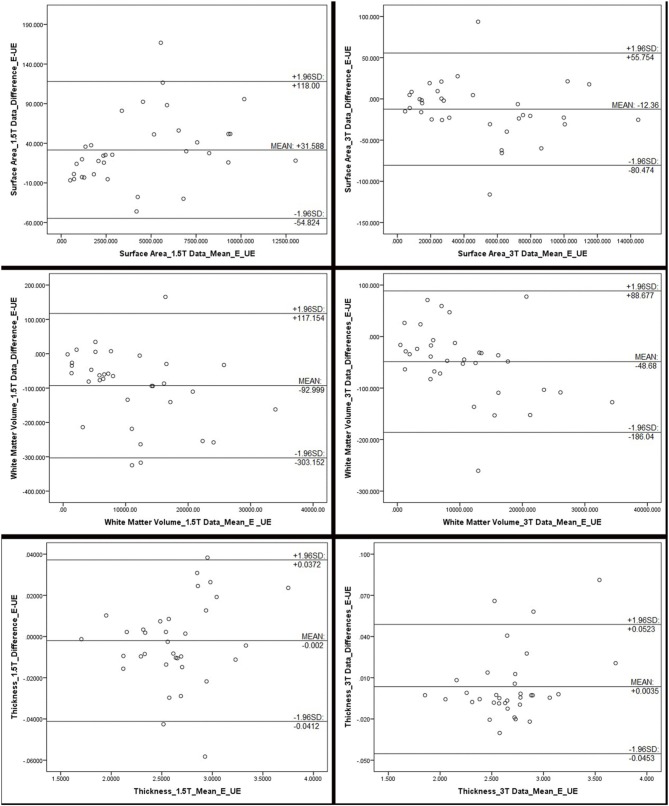
Figure 2.
Bland Altman plots, representing the differences between edited and unedited measures of surface area, white matter volume and cortical thickness for each field strength. The difference between the edited and unedited measure of each region of interest is plotted against the average of the two measures. Mean, and 95% limits, of agreement are provided in each plot. These plots indicate that, for the most part, the two methods are producing somewhat similar results, although all plots show a fairly wide range of values. Outliers, beyond the 95% agreement limit, indicating poor agreement, include: for surface area (1.5T): inferior temporal gyrus; surface area (3T): lateral orbitofrontal gyrus and insula; white matter volume (1.5T): insula, fusiform gyrus, inferior temporal gyrus; white matter volumes (3T): lateral orbitofrontal gyrus; thickness (1.5T): rostral anterior cingulate, pars orbitalis, and parahippocampal gyrus; thickness (3T): entorhinal cortex, inferior temporal gyrus, and medial orbitofrontal gyrus.

