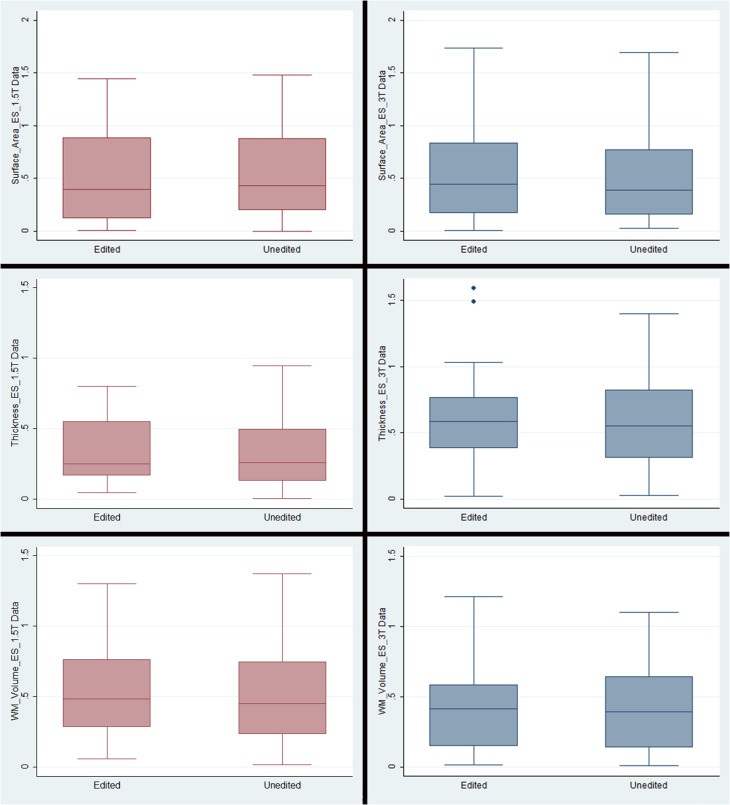
Figure 3.
Box plots representing means and standard deviations of effect sizes for each measurement type/field strength. Note that the only outliers were in the cortical thickness plots for the 3T data. The outlying regions of interest were pericalcarine thickness (1.49) and medial orbitofrontal thickness (1.60).

