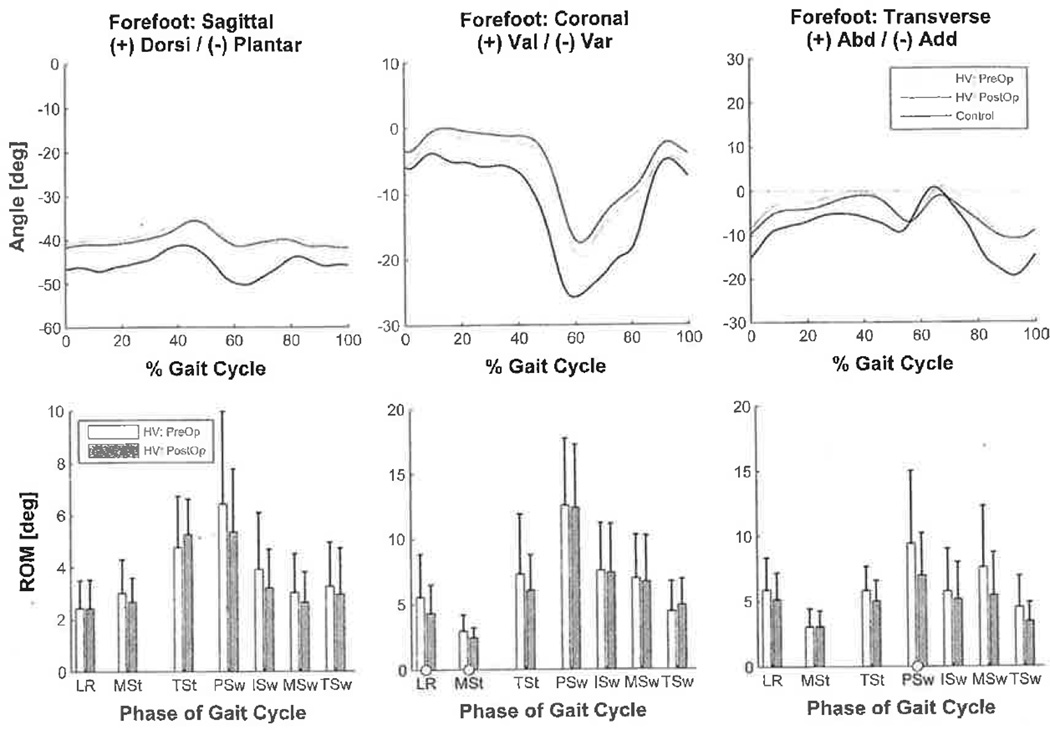
Fig. 2.
Upper: average forefoot kinematics during complete gait cycle (HVpre versus HVpost versus Normals). Circles denote phases of gait cycle with significantly different minimum and maximum positions (HVpre versus HVpost). Lower: forefoot ROM (average ± SD). Circles denote phases of gait cycle with significantly different ROMs (HVpre versus HVpost). Note: Forefoot kinematics were calculated relative to hindfoot.

