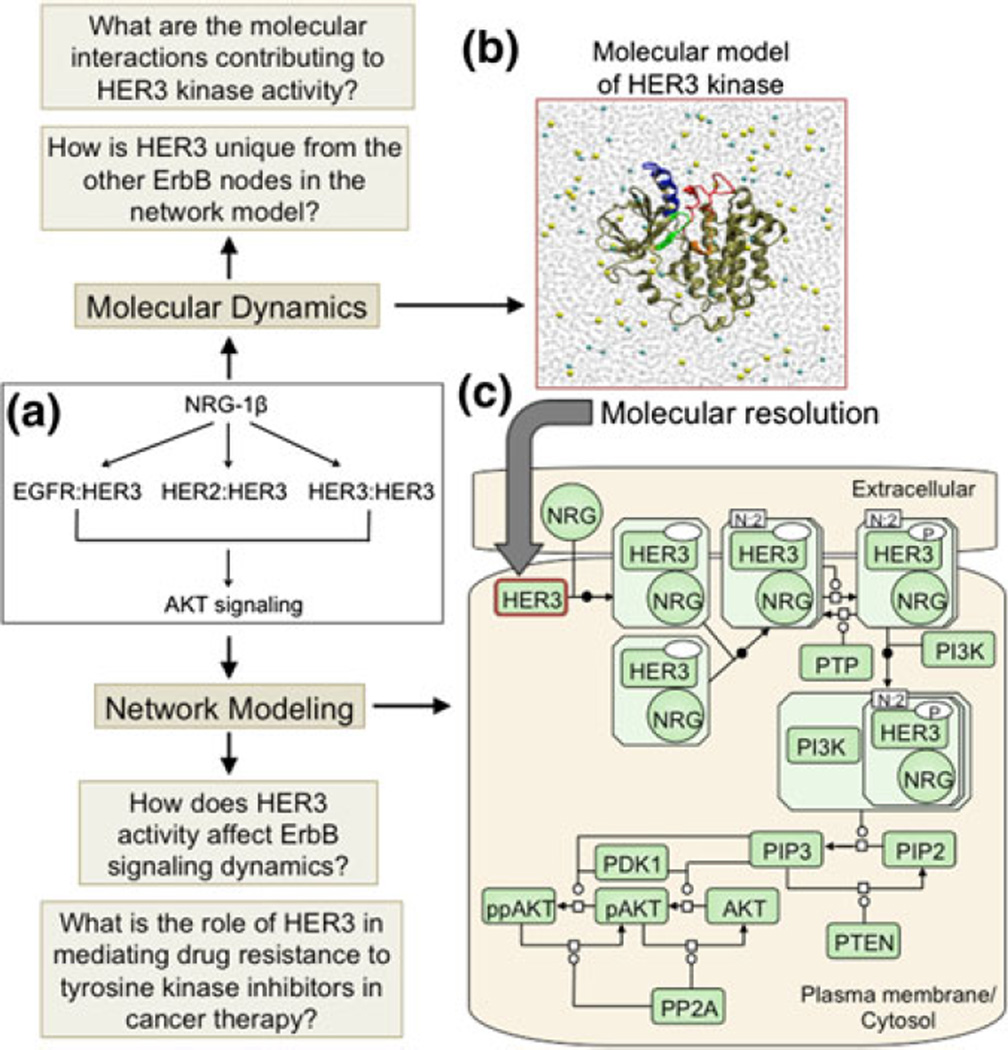
FIGURE 4.
(Reproduced with permission from Telesco et al.56). Representation of the multiscale model of HER3 activity. (a) Schematic of the HER3 network model topology, which focuses on ligand stimulation of EGFR:HER3, HER2: HER3, and HER3:HER3 dimers, inducing the AKT cascade. (b) The HER3 node in (a) is examined at molecular resolution. The molecular model comprises two parts: homology modeling to refine the HER3 kinase crystal structure, and molecular dynamics simulations of the refined HER3 structure to identify the molecular features which distinguish HER3’s unique mechanism of activity from that of the EGFR and HER2 nodes in the HER3 network model. (c) Process diagram of the HER3 network model in SBGN notation. The aim of the HER3 network model is to investigate the implications of HER3 activity for ErbB signaling dynamics and mechanisms of HER3-mediated drug resistance in an ErbB-driven tumor cell in silico. Note that, for clarity, only HER3 dimers are illustrated in (c), although EGFR:HER3 and HER2:HER3 dimers are also present in the network model.

