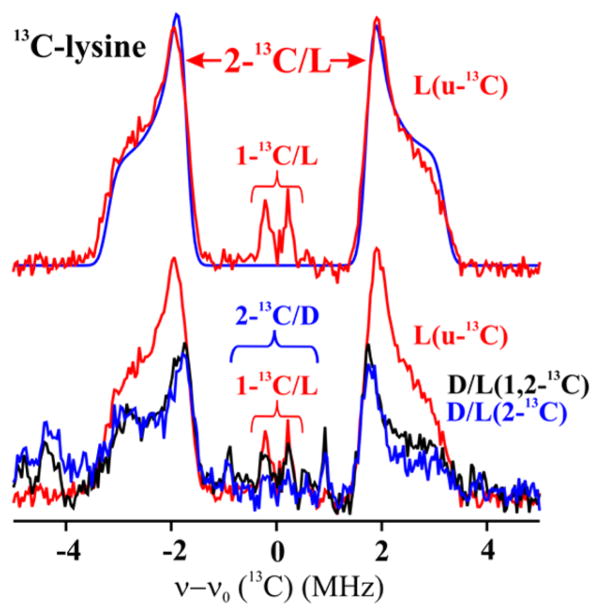
Figure 3.
Davies 13C ENDOR for LAM with anSAM, PLP and substrate with simulation spectrum. Spectra were collected at the radical peak. The baseline spectrum from unlabeled Lys has been subtracted for all Davies spectra. Upper: u-13C Lys, with assignments derived from spectra of isotopologues. Simulation, upper, in blue calculated with parameters: Aiso = 4.5 MHz, 2T = 2.0 MHz, ENDOR line-width, 0.35 MHz. Lower: as described in text using partially labeled Lys (Chart 1). Experimental conditions: MF = 34.6–34.8 GHz, MW pulse length (π) = 120 ns, τ = 600 ns T = 2 K.

