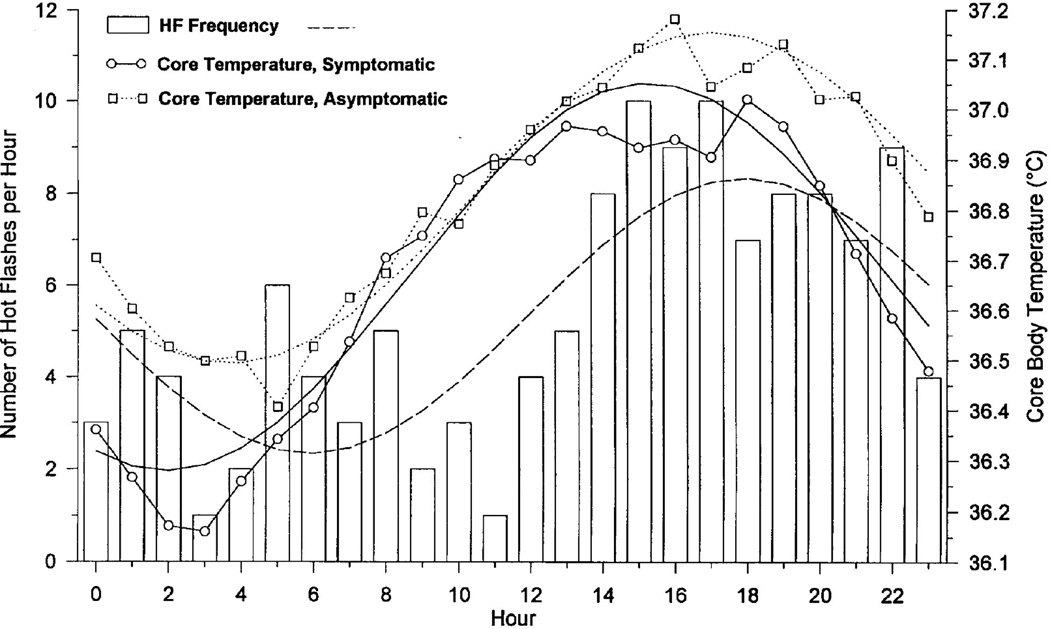
Fig. 3.
Hot flash frequency and Tc during 24h. Hot flash frequency in 10 symptomatic women (bars); best-fit cosine curve for hot flash frequency (dashed line); 24h Tc data for 10 symptomatic women (○) with best fit cosine curve (solid line); 24h Tc data in 6 asymptomatic women (□) with best-fit cosine curve (dotted line).

