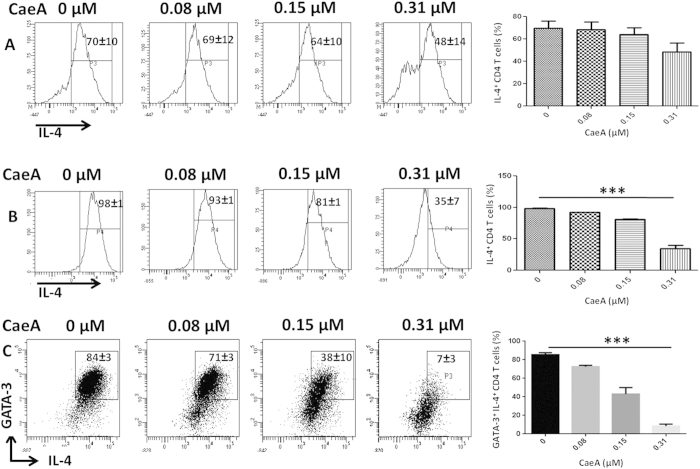
Figure 1. CaeA suppresses Th2 response.
(A) Th2 cells or (B,C) naïve CD4 T cells differentiated under Th2 polarizing conditions were treated with CaeA (0–0.31 μM). The cells were analyzed for the intracellular expression of (A,B) IL-4; (C) IL-4 and GATA3 on CD4 T cells by flowcytometry. (A) The data in the inset of flowcytometer histograms depicts percentage of cells from 3 independent experiments. (B,C) The data is representative of 3 independent experiments and mean ± SEM in the inset of flowcytometer histograms and dot plots depicts percentage of cells from duplicate wells. Bar diagram are representative of flowcytometry data. ***p < 0.0005.

