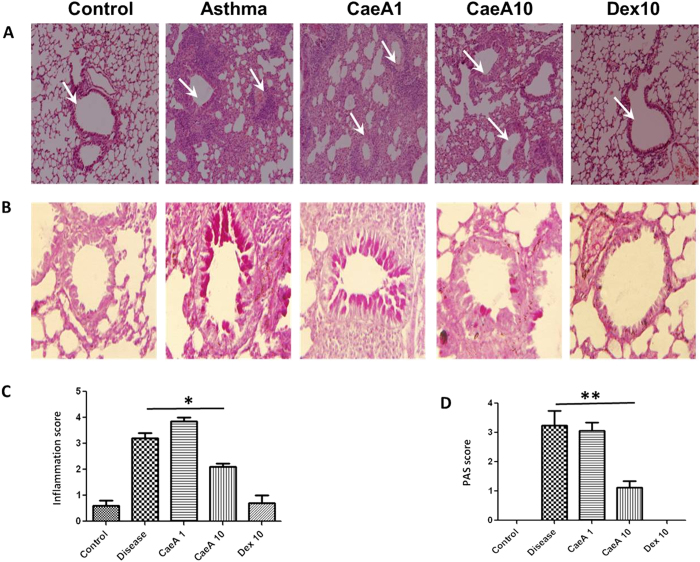
Figure 3. Histology of lung sections.
Allergic asthma induced mice were treated with CaeA1 (1 mg/kg bwt) and CaeA10 (10 mg/kg bwt). Animals suffering from asthma receiving Dex10 (10 mg/kg bwt) were kept as a positive control. The experimental and control groups of mice were sacrificed and the lungs were isolated and fixed in formalin solution. Representative microscopic photographs of sections were stained with (A) hematoxylin and eosin for the inflammatory cell infiltration analysis and (B) periodic acid-Schiff for the quantification of goblet cells. (A) Images of lung sections, the arrows denote decrease cellular infiltration by CaeA and Dex. (B) Image of lung section shows decrement in number and extent of goblet cell hyperplasia on CaeA and Dex treatment. Bar graph represents semi quantitative scoring of (C) inflammatory cell infiltration (mean ± SEM scores were obtained from 5 animals) and (D) PAS positive cells (mean±SEM scores were obtained from 3 animals). *p < 0.05, **p < 0.005.

