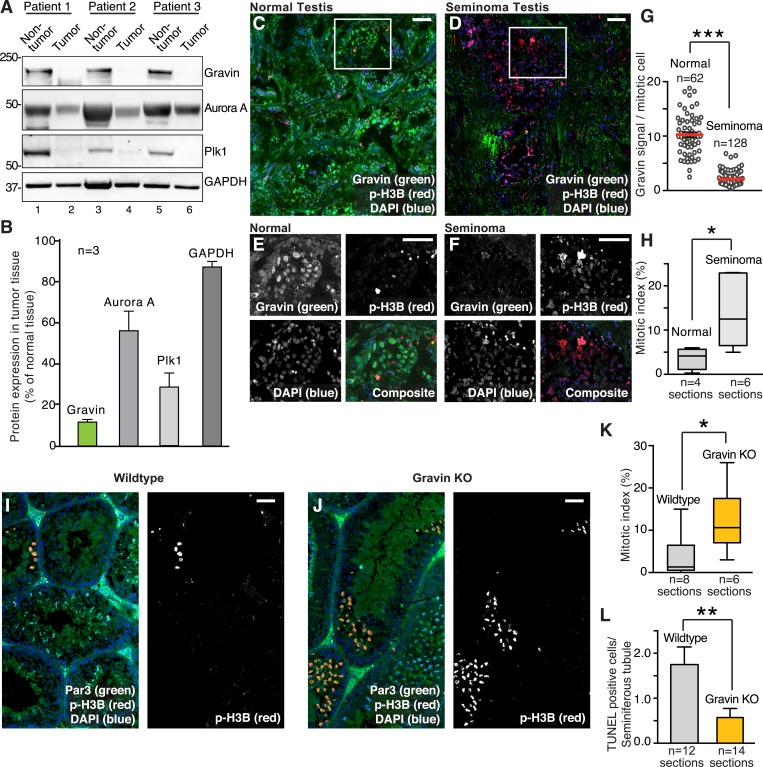
Figure 1. Loss of Gravin correlates with perturbed mitosis in human seminomas and mouse seminiferous tubules.
(A) Immunoblot analysis of tissue lysates from resected seminomas (lanes 2, 4, and 6) and normal adjacent tissue (lanes 1, 3, and 5). Proteins were identified using antibodies against (top) Gravin, (upper-mid) Aurora A, (lower-mid) Plk1, and (bottom) GAPDH loading control. (B) Quantification of immunoblot data (A) by densitometry (n = 3 ± SEM). (C, D) Representative testis sections from (C) a 30-year-old individual and (D) a 26-year-old seminoma patient. Immunofluorescent staining shows Gravin (green), p-H3B (red), and DNA (DAPI, blue). Scale bar, 40 μm. (E, F) Magnified insets from C and D are included. Scale bar, 40 μm. (G) Gravin signal intensity per mitotic cell was quantified from normal and seminoma sections of testis (p-H3B positive, n-values are indicated, ***p < 0.001). The number of cells used in each analysis is indicated. (H) The mitotic index was calculated for (normal; n = 4) and (seminoma; n = 6) tissue sections by determining the percentage of pH3B-positive cells. (*p < 0.05). (I, J) Related experiments were conducted on testis sections from 7-week-old wild-type (I), and Gravin knockout (J) mice. Immunostaining with antibodies against Par3 (green), p-H3B (red), and DAPI (blue) is presented. Scale bar, 40 μm. (K) Calculation of the mitotic index in testis sections from wild-type (gray) and Gravin knockout (orange) mice. The number of tissue sections measured is indicated below each column (*p < 0.05). (L) TUNEL staining was used to monitor apoptosis in seminiferous tubule sections from wild-type (gray) and Gravin knockout (orange) mice. Data are presented as TUNEL-positive cells per seminiferous tubule. The number of sections is depicted below each column. (**p = 0.01).


