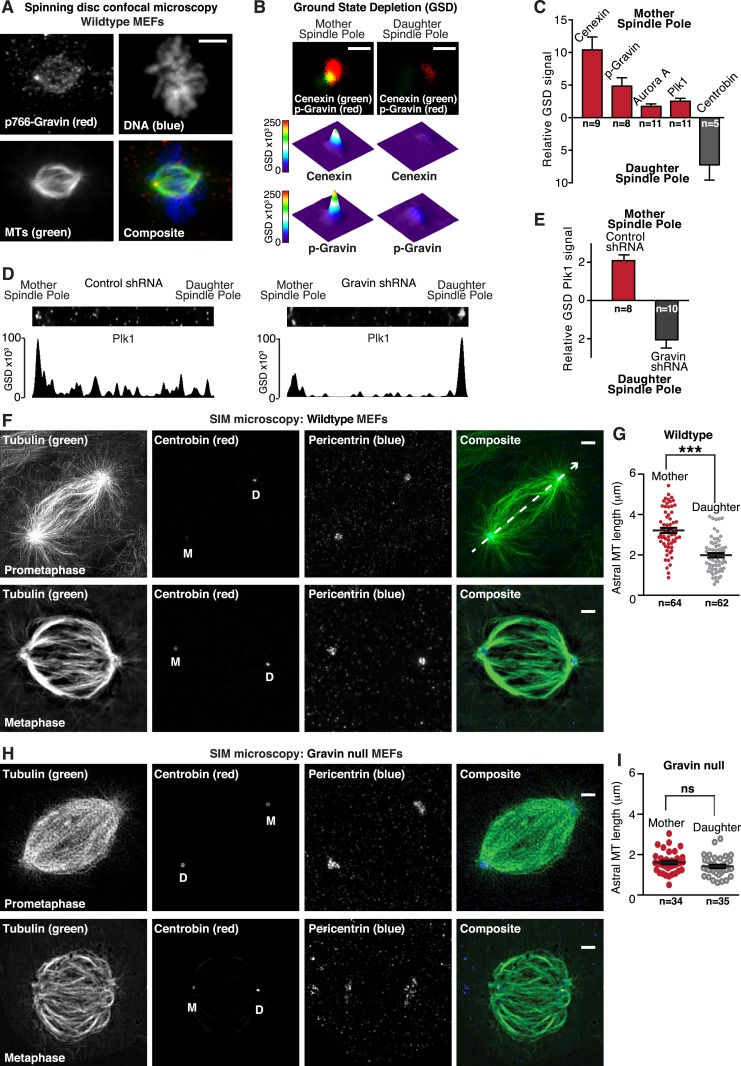
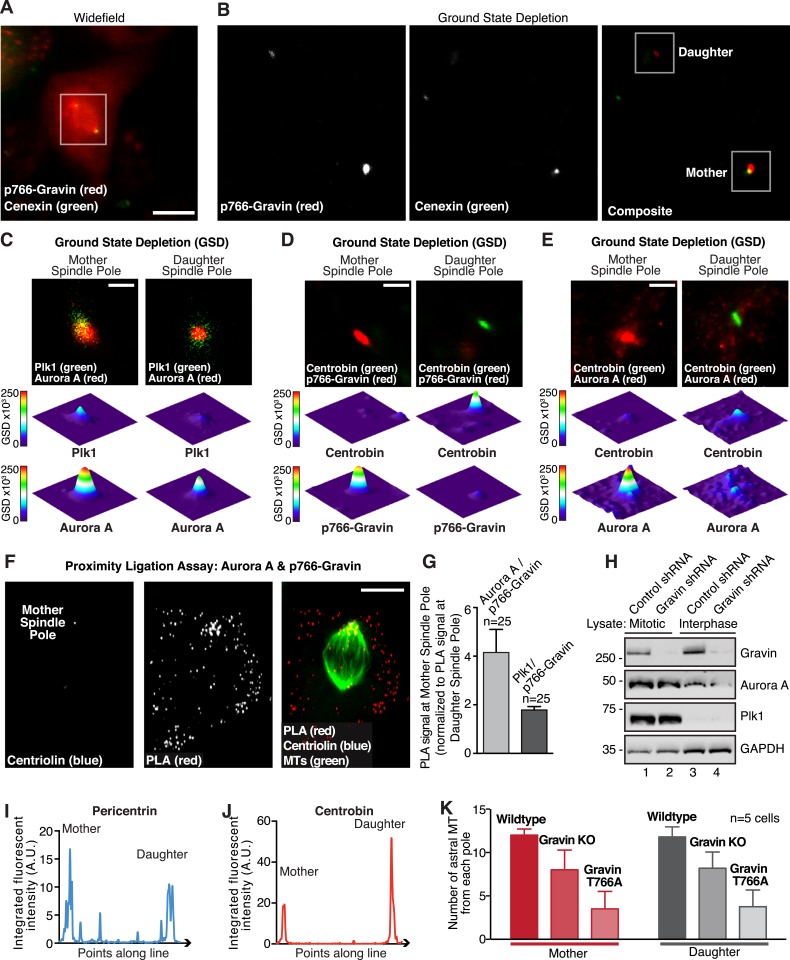
Figure 4. Gravin-Aurora A-Plk1 scaffold is preferentially sequestered at mother spindle poles.
(A) Spinning disc confocal micrograph (maximum projection) of a metaphase wild-type MEF depicts asymmetric enrichment of p766-Gravin (red) at one spindle pole. Counterstaining with tubulin (MTs, green) and DAPI (DNA, blue) are shown. Composite image is shown. Bar, 5 μm. (B) Ground state depletion microscopy (GSDIM) was performed on prometaphase HEK293 cells (top). Cells were immunostained for a mother spindle pole marker, Cenexin (green) and p-Gravin (red). Quantification of these signals is shown below micrographs. Integrated intensity profiles for (top) cenexin and (bottom) p-Gravin at the mother spindle pole (left). Intensity profiles for both proteins at the daughter spindle pole are also presented (right). Scale bar, 1 μm. (C) Relative GSD signals for p766-Gravin, Aurora A, Plk1, and Cenexin at the mother spindle pole (red). Centrobin (gray) was used as a daughter spindle pole marker. Cell numbers used in each calculation are indicated on graph (n = 3 experiments ± SEM). (D) GSDIM micrographs showing the distribution of Plk1 at spindle poles in (top, left) control and (top, right) Gravin-depleted HEK293 cells. Densitometric analyses depict the asymmetric distribution of Plk1 at mother and daughter spindle poles in (bottom, left) control and (bottom, right) Gravin knockdown cells. (E) Amalgamated data are shown in graph. Cell numbers used in each calculation are indicated on graph (n = 3 experiments ± SEM). (F) SIM maximum projection of (top) wild-type and (bottom) Gravin null MEFs at metaphase. Immunostaining for tubulin (green), centrobin (red), and pericentrin (blue) are presented. The daughter spindle pole was decorated with centrobin (red) and marked on the micrograph with D, whereas the mother spindle pole is denoted with M. Composite images are included. Dashed line (white) depicts path of line-scan used to determine which pole contained the most centrobin (see Figure 4—figure supplement 4I and J). Scale bar, 2 μm. (G) Comparison of astral microtubule (MT) length (μm) protruding from the mother (red; n = 64) and daughter spindle poles (gray, n = 62) in wildtype MEFs (n = 5 cells, ±SEM, ***p < 0.0001). (H–I) Quantitation of astral microtubule (MT) length protruding from the mother (red; n = 34) and daughter spindle poles (gray, n = 35) in Gravin null MEFs (n = 5 cells, ±SEM, ns depicts not significant).


