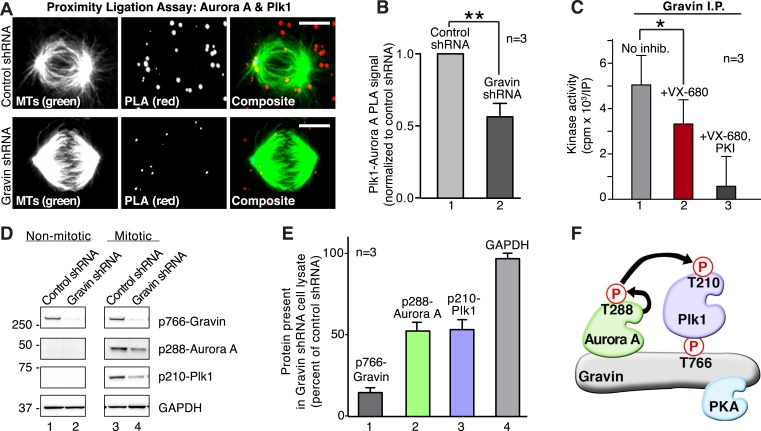
Figure 5. Gravin scaffolds an Aurora A and Plk1 kinase-network.
(A) PLA (red) to identify the frequency and subcellular distribution of the in situ interaction between Aurora A and Plk1 in mitotic HEK293 cells. Staining of microtubules (green) is indicated. (Top) Cells treated with control shRNA, and (bottom) cells treated with Gravin shRNA. Bar, 5μm. (B) Quantitation of PLA signal intensity in (light gray) control and (dark gray) Gravin-depleted cells. One hundred fifty cells were analyzed for each condition from three independent experiments (±SEM, **p < 0.01). (C) Gravin immune complexes isolated from mitotic lysates were assayed for protein kinase activity using Kemptide (300 μM) as a substrate. Quantitation of 32P phosphate incorporation was measured by scintillation counting (n = 3 ± SEM, *p < 0.05). Total kinase activity (gray) is compared to enzyme activity in the presence of the Aurora A inhibitor alone (VX-680, red) or VX-680 and a PKA inhibitor (PKI, black). (D) Phospho-peptide antibodies were used as an index of Aurora A and Plk1 activity in Gravin immune complexes. Immunoblots show levels of (top) p766-Gravin, (mid) p288-Aurora A, and (lower) p210-Plk1 upon shRNA mediated depletion of Gravin from HEK293 cells. (Bottom) GAPDH loading controls are indicated. (E) Densitometric analysis of amalgamated data from three experiments as shown in (D) (±SEM). (F) A model depicting the proposed flow of phosphorylation signals through a Gravin associated Aurora A and Plk1 cascade.

