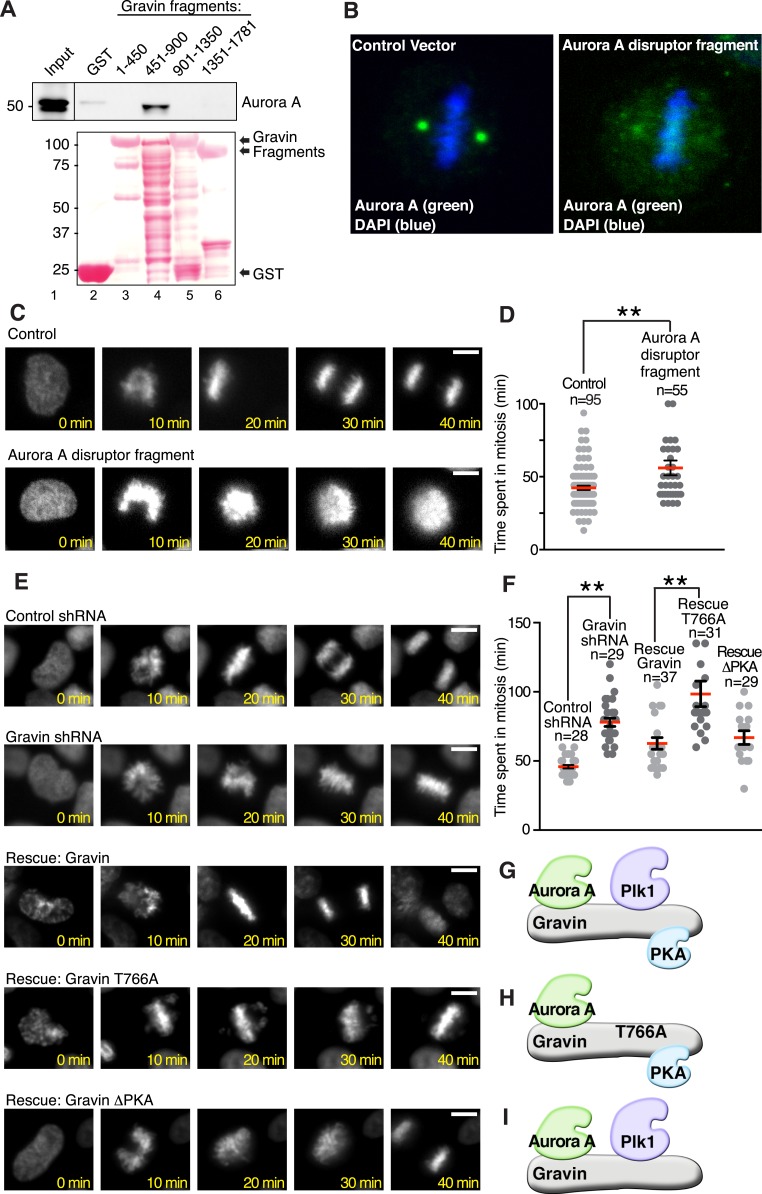
Figure 6. Gravin-scaffolding of Aurora A and Plk1 facilitates metaphase progression.
(A) Direct binding of purified Gravin GST-fusion proteins (first and last amino acid number of each fragment is denoted above each lane) with recombinant V5-tagged Aurora A kinase (generated by in vitro transcription and translation). (Top) Immunoblot detection of Aurora A in complex with GST-Gravin fragments. (Bottom) Ponceau stained blot shows protein expression levels. (B) Spinning disc confocal image (maximum projection) of a metaphase cell (control vector, left) stained for (green) Aurora A and (blue) DNA. The subcellular rearrangement of Aurora A following over-expression of the Aurora A disruptor fragment (right). DNA is shown in blue (DAPI). (C) Live cell imaging of HeLa cells stably expressing H2B-GFP were monitored through mitosis from the time of DNA condensation until anaphase exit. Shown are (top panels) a representative control cell and (bottom panels) a cell expressing the Aurora A disruptor fragment. Bar, 5 μm. (D) Amalgamated data from multiple cells stably expressing H2B-GFP and monitored for time spent in mitosis. Control cells (n = 95 cells) and Aurora A disruptor expressing cells (n = 55 cells) were from three independent experiments (**p < 0.001 ). (E–I) Live cell imaging time courses (0–40 min) of cells stably expressing H2B-GFP transfected with (top) control shRNA and (second) Gravin shRNA. Rescue experiments as indicated with (third) murine Gravin; (fourth) murine Gravin T766A; and (fifth) murine GravinΔPKA. Bar, 5 μm. (F) Amalgamated data from multiple cells treated with control or Gravin shRNA, and rescued with murine Gravin as shown in E. These cells were stably expressing H2B-GFP and monitored for time spent in mitosis. Total cell numbers are indicated on graph (from three independent experiments, **p-values <0.001). (G–I) Models depicting the kinase-binding properties of the Gravin mutants used in time course experiments E and F: rescue with intact Gravin (G), Gravin T766A (H), and GravinΔPKA (I).


