
Figure 3. Differentiation-Dependent Binding Sites Show Distinct Patterns of Enhancer-Associated H3K4me1.
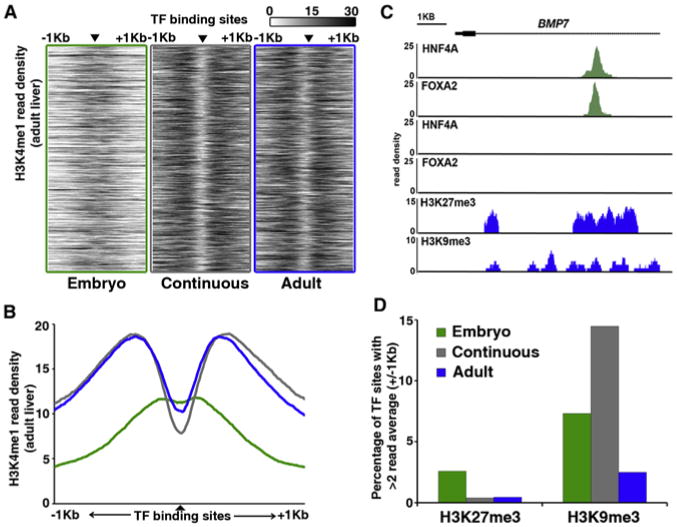
(A) Heatmap representation of H3K4me1 at regions bound by both HNF4A and FOXA2 (▲) in embryonic liver only (green, left), both embryonic and adult liver (gray, middle), or adult liver only (blue, right). Enrichment levels (white, low; black, high) were profiled ±1 kb at a resolution of 10 bp from the TF peak center, represented by the small black triangle. The vertical ordering of sites is random.
(B) Average enrichment profiles of H3K4me1 at differentiation-dependent HNF4A and FOXA2 binding sites (green line, embryo; gray line, continuous; blue line, adult).
(C) Read density histograms proximal to the BMP7 locus, displaying HNF4A and FOXA2 ChIP-seq data sets generated from embryonic hepatoblasts (green), and HNF4A, FOXA2, H3K27me3, and H3K9me3 ChIP-seq data sets generated from adult hepatocytes (blue).
(D) Percentage of differentiation-dependent binding sites showing >2 average read enrichment for repressive histone modifications H3K27me3 or H3K9me3 within 2 kb regions surrounding TF-binding sites.
See also Figure S3.