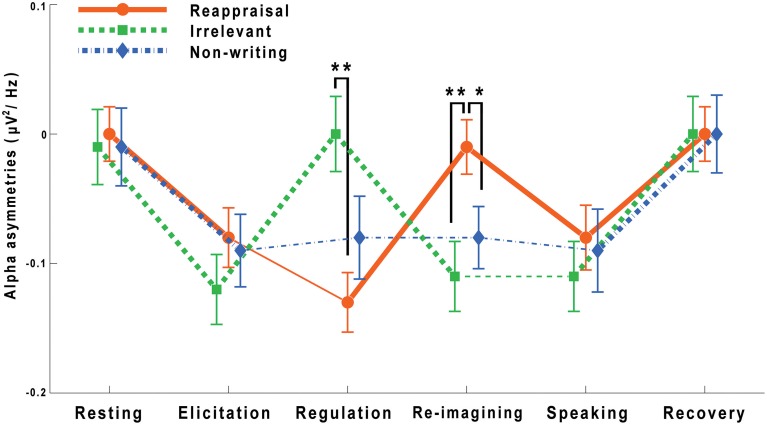
Figure 3.
Frontal alpha asymmetries throughout the entire task. Averaged FAAs (M ± SEM) of the frontal R-L pair are shown. The asterisks on the top of the figure indicate significant group differences at the regulation stage and the re-imagining stage (*P < 0.05, **P < 0.01). The thicker line segments indicate significant differences of adjacent stages for each group.

