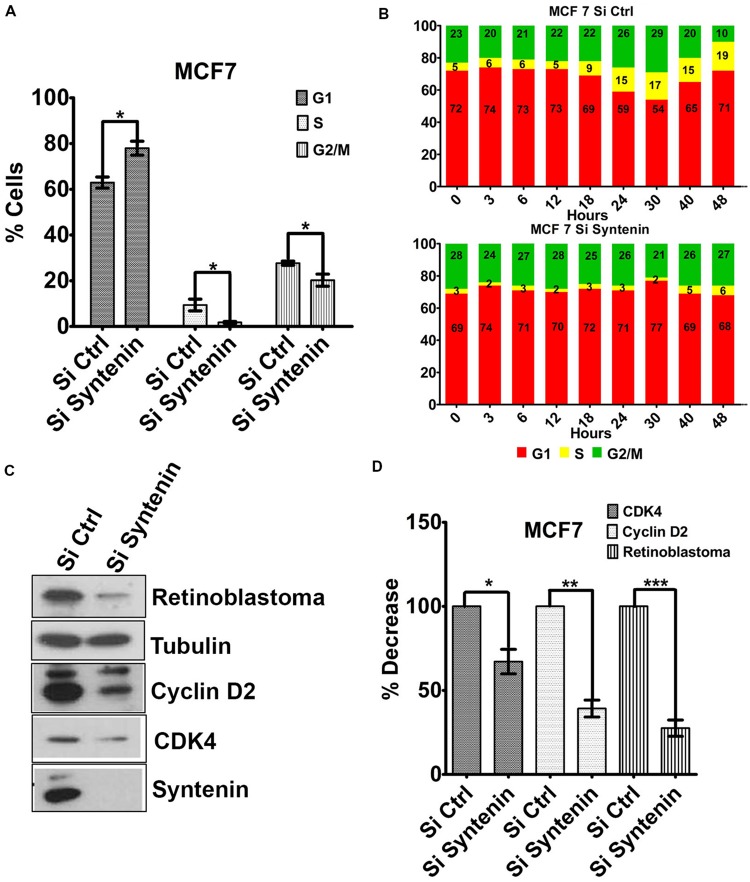
FIGURE 5.
Downregulation of syntenin impairs cell cycle G1/S transition in MCF7 cells. (A) Bar graph representing the percentage of cells in G1, S, and G2/M cell cycle phases after synchronization. Cells were transfected with non-targeting siRNA (Si Ctrl) or Syntenin siRNA (Si Syntenin). n = 5, bars represent mean value ± SD, ∗P < 0.05 (Student’s t-test). (B) Bar graphs illustrate one kinetic experiment indicating the percentage of cells in G1, S, and G2/M cell cycle phases after serum stimulation, at different time points, as indicated, in cells transfected with non-targeting siRNA (top) or Syntenin si RNA (bottom). (C) Western blot comparing the expression levels of different cell cycle markers, as indicated, in control cells (Si Ctrl) and Syntenin-depleted (si Syntenin) cells. Tubulin was used as loading control. Note that the expression of Cyclin D2, CDK4, and Rb is downregulated in syntenin-depleted cells. (D) Bar graph indicating the expression level of cell cycle markers in Syntenin-depleted cells relative to controls (taken as 100%). n = 3, 4, and 5 for Cyclin D2, Rb, and CDK4, respectively, bars represent mean value ± SD, ∗P < 0.05, ∗∗P < 0.01, ∗∗∗P < 0.001 (Student’s t-test).

