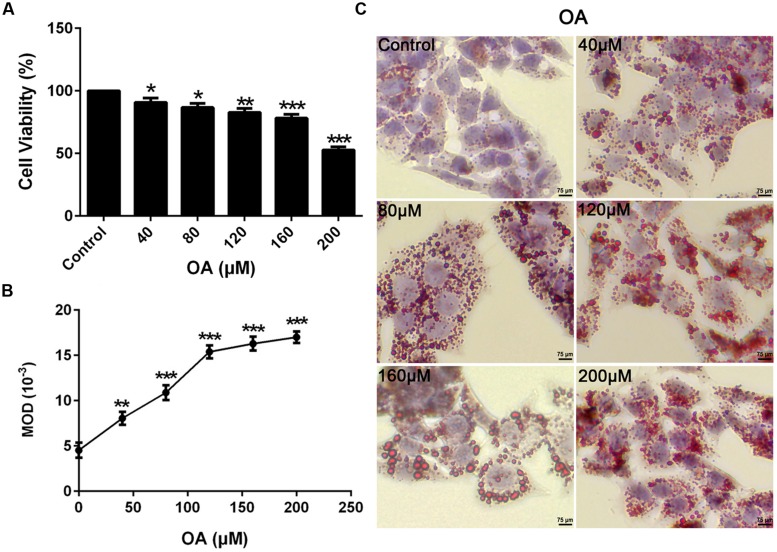
FIGURE 1.
Oleic acid-induced TG accumulation in HepG2 cells. (A) The Dose dependent effect of OA (40, 80, 120, 160, and 200 μM) on cytotoxicity in HepG2 cells. (B,C) The effect of OA (40, 80, 120, 160, and 200 μM) on TG accumulation in HepG2 cells. Original magnification was 200×, scale bars represent 75 μm. Values are Mean ± SEM of three independent experiments performed in triplicates. Statistically significant at ∗P < 0.05, ∗∗P < 0.01 and ∗∗∗P < 0.001 compared with the control.

