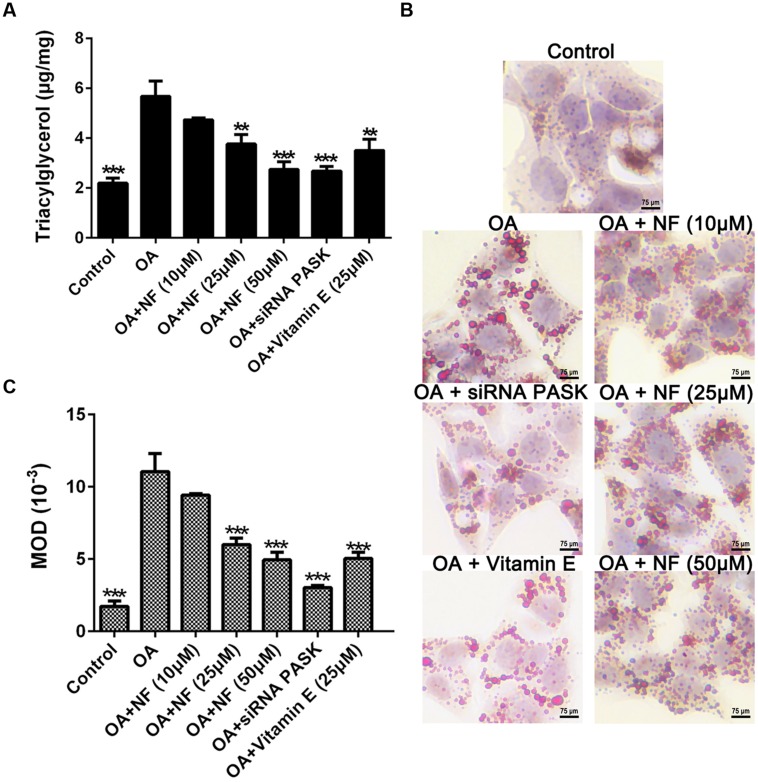
FIGURE 3.
The effect of nuciferine or siRNA PASK on TG accumulation in HepG2 cells of OA-induced hepatic steatosis. (A) TG concentration tested by ELISA. (B,C) Oil-red-O staining. Original magnification was 200×, scale bars represent 75 μm. SiRNA PASK HepG2 cells and HepG2 cells incubated with increasing concentrations of nuciferine (NF: 10, 25, and 50 μM) or vitamin E (25 μM) both treated with OA (40 μM). The measurement was described in the Section “Materials and Methods”. Values are Mean ± SEM of three independent experiments performed in triplicates. Significant differences with OA group were designated as ∗∗P < 0.01 and ∗∗∗P < 0.001. (Control, siRNA scrambled; NF, Nuciferine.)

