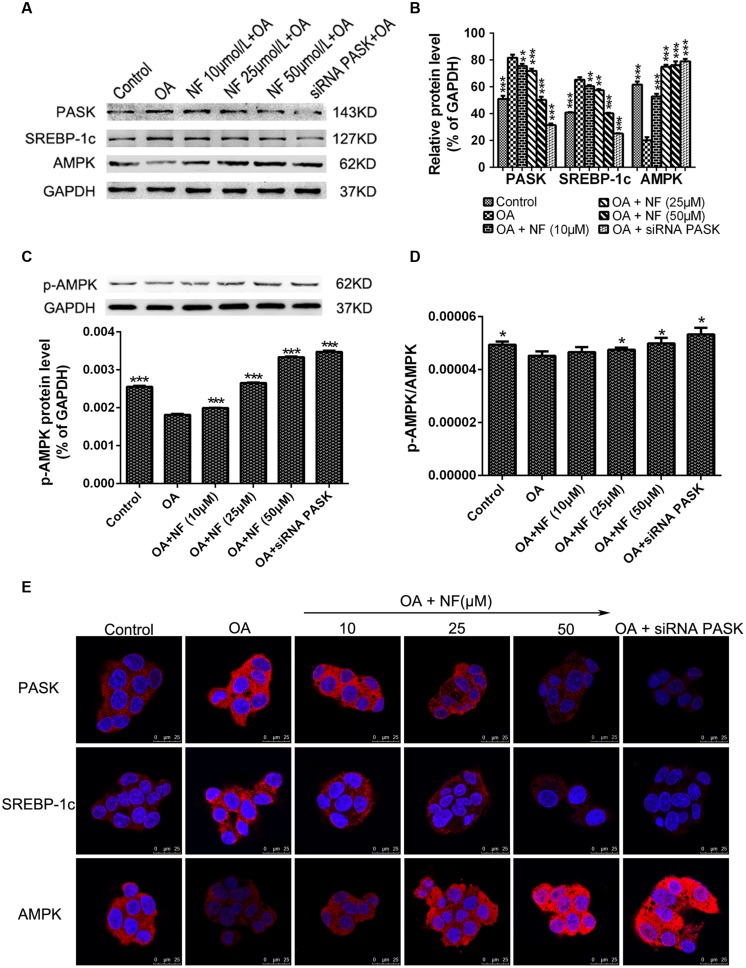
FIGURE 6.
The effect of nuciferine or siRNA PASK on the expression of proteins related to hepatic steatosis in HepG2 cells. (A–C) Western blot for PASK, SREBP-1c, AMPK, and p-AMPK. (D) The ratio of pAMPK/AMPK (p-AMPK∗GAPDH(A)/GAPDH(p)∗AMPK). (E) Immunostaining for PASK, SREBP-1c and AMPK (red) and the nuclear dye DAPI (blue), scale bars represent 25 μm. SiRNA PASK HepG2 cells and HepG2 cells incubated with increasing concentrations of nuciferine (NF: 10, 25, and 50 μM) both treated with OA (40 μM). The measurement was described in the Section “Materials and Methods”. Values are Mean ± SEM of three independent experiments performed in triplicates. Significant differences with OA group were designated as ∗∗P < 0.01 and ∗∗∗P < 0.001. (Control, siRNA scrambled; NF, Nuciferine.)

