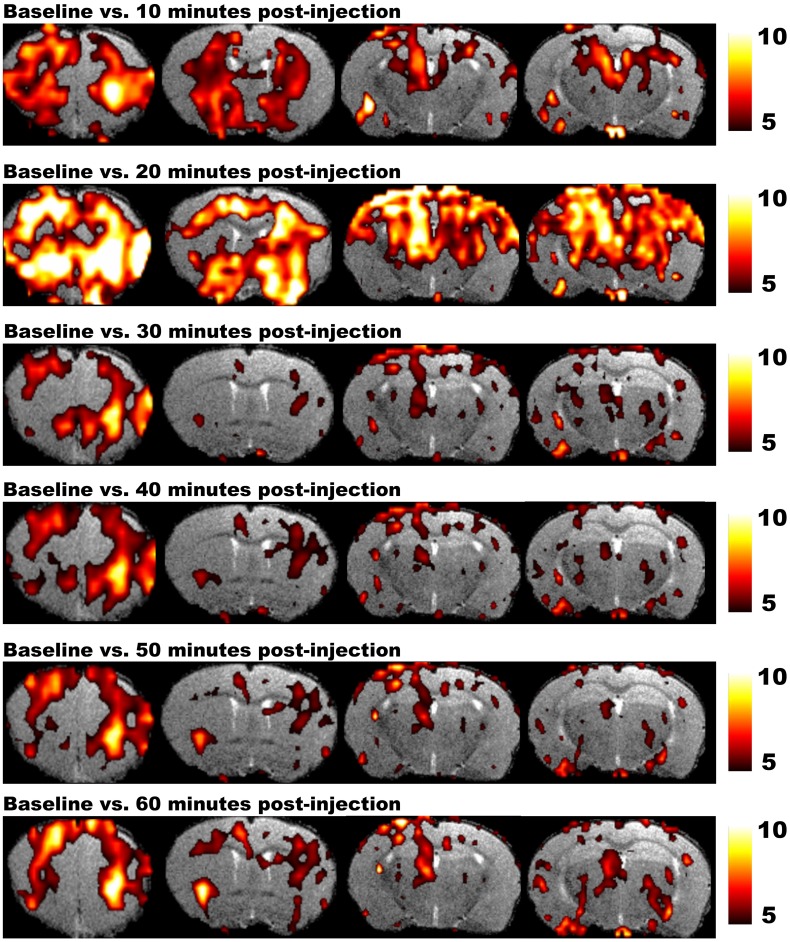
FIGURE 4.
Results of phMRI with a single bolus of medetomidine. This figure shows four consecutive slices of the statistical difference maps of the BOLD signal at 10, 20, 30, 40, 50, and 60 min post-injection (medetomidine, 0.3 mg/kg, s.c.) vs. baseline. The statistical maps are shown on a T2-weighted anatomical MRI template. The color scale at the right indicates the T-value (i.e., the strength of the T2∗ signal intensity decrease induced by medetomidine vs. baseline in all conditions). Medetomidine induces T2∗ signal changes at 10 min post-injection vs. baseline, mainly in frontal regions and the striatum. At 20 min post-injection, the T2∗ signal changes increase and include additional regions such as the sensory cortex, hippocampus and thalamus. Starting from 30 min post-injection, medetomidine-induced T2∗ signal changes start to decrease and stabilize until 60 min post-injection (Shah et al., 2015a).

