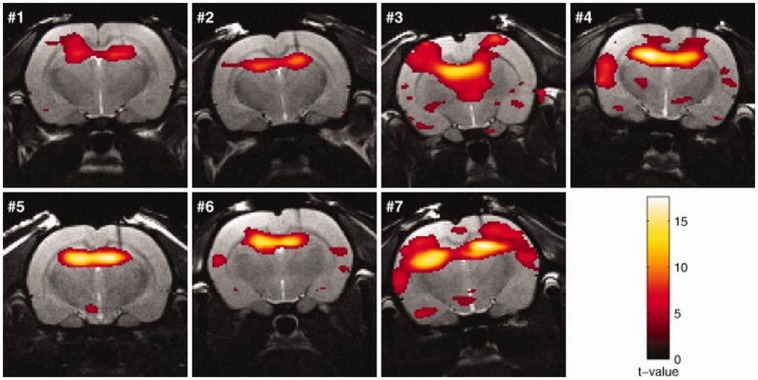
FIGURE 5.
Activation maps (rats no. 1–7) in response to kainic acid–induced seizures superimposed on the anatomic images. The threshold for statistical significance was set at p < 0.05 (FWE corrected). Rats were sedated with medetomidine (figure reproduced with permission of John Wiley and Sons; Airaksinen et al., 2010).

