
Figure 6.
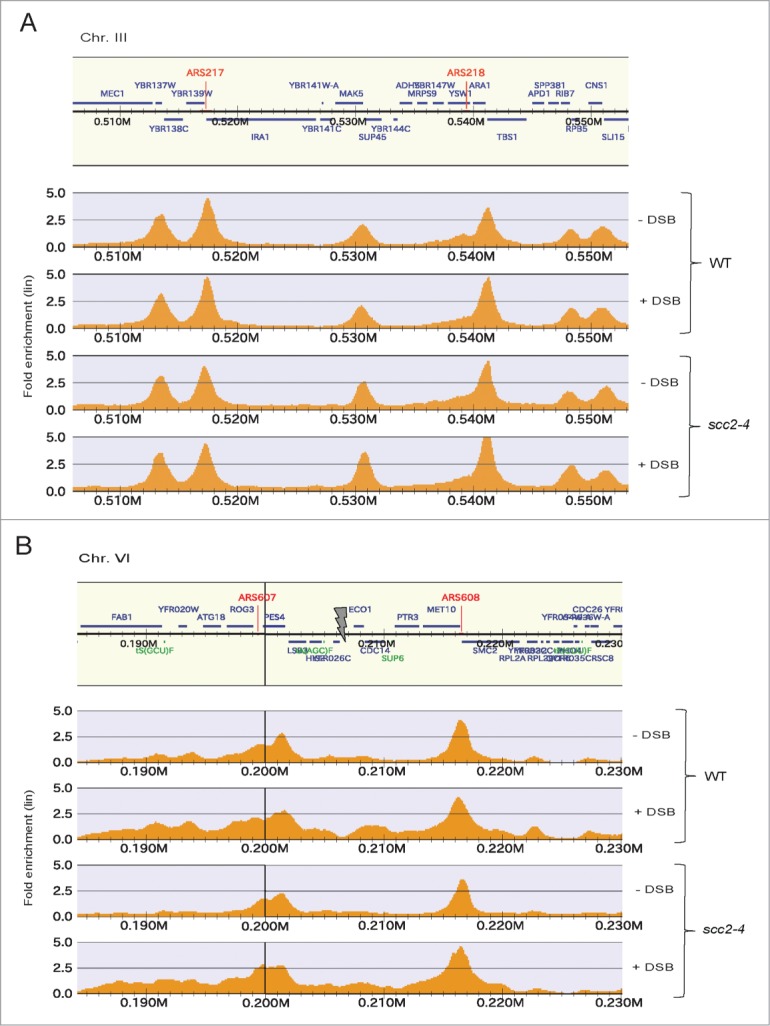
Cohesin binding genome wide and at the Chr. VI DSB. (A and B) Chromosomal association of Flag-tagged Scc1 analyzed by ChIP sequencing in WT and scc2–4 cells in the presence and absence of DSB induction at Chr. VI as indicated. Orange peaks display significant chromosomal binding sites where the x-axes show chromosomal positions and the y-axes show linear fold enrichment. (A) Shown is a representative undamaged region of Chr. III. (B) Shown is the region immediately surrounding the DSB on Chr. VI. Gray arrow points at the HO break site.