Figure 5.
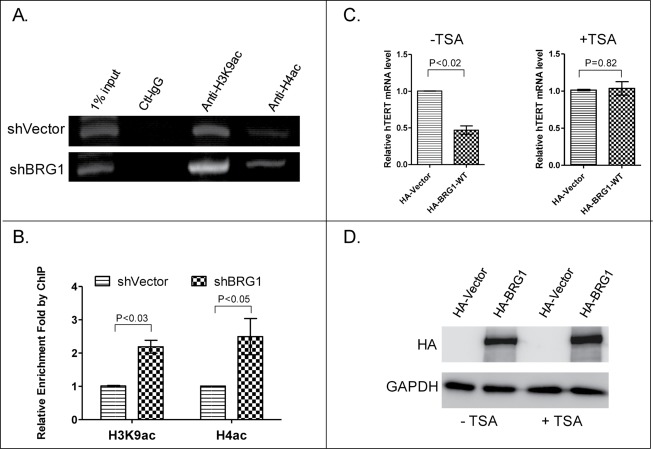
Quantification of H3K9ac and H4ac at the TSS of hTERT promoter with or without depletion of BRG1. (A) qPCR analysis of H3K9ac and H4ac-immunopreciptated chromatin in BRG1-depleted HeLa (shBRG1) and control cells (shVector). (B) Quantitation of data in (A). Mean ± SD are shown; Three independent experiments were performed. (C) qRT-PCR of hTERT mRNA in HeLa cells with or without exposure to TSA and with or without BRG1-overexpression (HA-BRG1 vs HA-Vector). (D) Western blot for BRG1 in HeLa cells treated with or without TSA. P values were calculated using the Student's t-test.

