Figure 3.

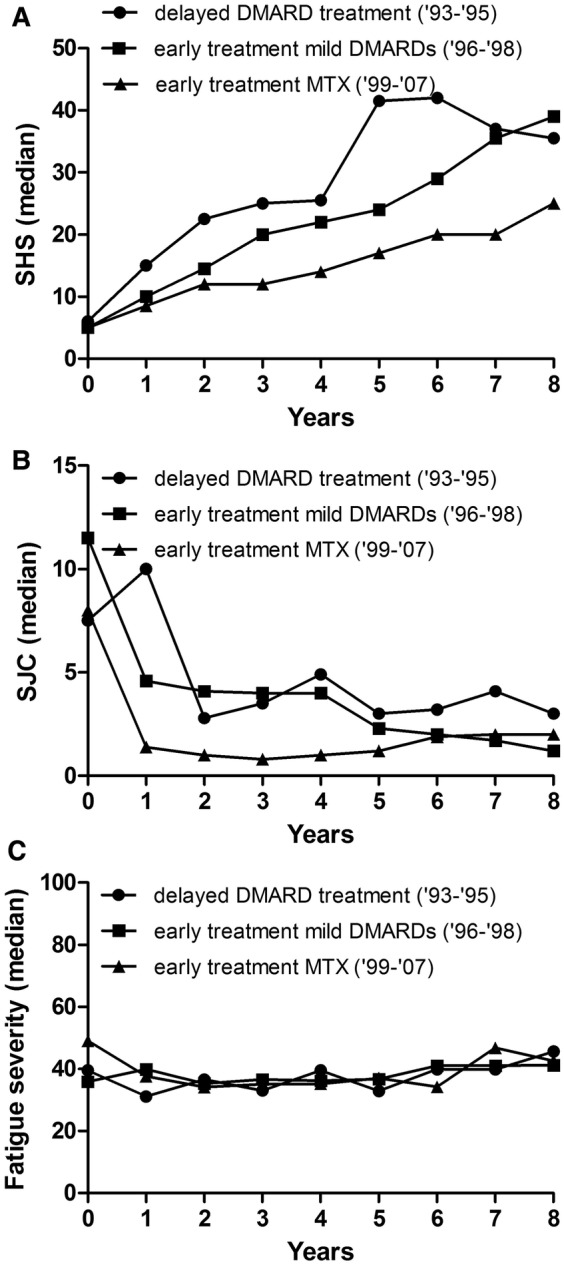
Different treatment strategies in rheumatoid arthritis in relation to radiographic progression (A) number of swollen joints (B) and fatigue severity over time (C). Presented are three long-term outcomes in relation to treatment strategies. Treatment strategies are reflected by different inclusion periods as the initial treatment strategy differed for different inclusion periods. The inclusion period 1993–1995 comprised 100 patients, 1996–1998 166 patients and 1999–2007 360 patients. Radiographic progression: 1993–1995=reference, 1996–1998 β=0.97 p=0.026; 1999–2007 β=0.92 p<0.001. The β indicates the fold rate of joint destruction per year compared to the reference. Swollen joint count: 1993–1995=reference, 1996–1998 effect size=−1.4 p=0.005; 1999–2007 effect size=−3.6 p<0.001, omnibus test for overall significance of model p<0.001. The effect size indicates the difference in number of swollen joints compared to the reference. Fatigue severity: 1993–1995=reference, 1996–1998 p=0.80; 1999–2007 p=0.79; omnibus test for overall significance of model p=0.96. SHS, Sharp-van der Heijde score; SJC, swollen joint count; DMARD, disease-modifying antirheumatic drugs.
