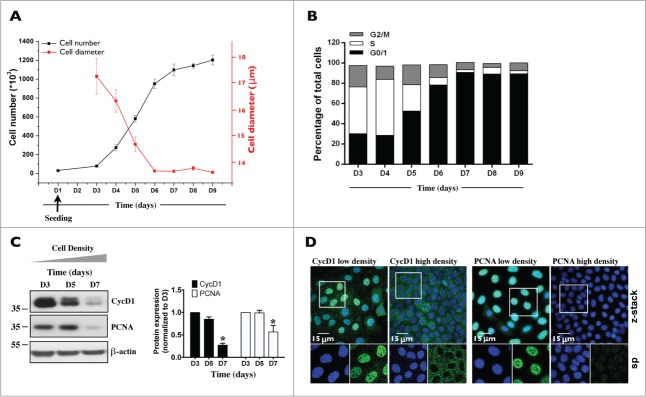
Figure 2.

Characterization of mCCDcl1 cell proliferation. Cells were seeded at day 1 (D1) as described in Materials and Methods and various parameters of cell proliferation were examined over time (D1 - D9). (A) Cell number was estimated by trypsinizing and counting cells with a hemocytometer. Cell diameter was estimated by ImageJ analysis of images taken prior to cell trypsinization. Data is represented as fold increase of cell number (black squares) and cell area (red squares) over values obtained 3 d (D3, for cell number analysis) and 6 d (D6, for cell area analysis) after seeding. (B) Cell cycle analysis by flow cytometry. Data shown is representative of one of 3 similar experiments. (C) Western blot of whole-cell CycD1 and PCNA. β-actin was used as a loading control. Quantification of data, shown at right, is represented as fold difference of protein expression over values obtained at D3 and is expressed as the mean ± SEM of 3 independent experiments. (D) Confocal z-stacks of CycD1 (green, left panels) and PCNA (green, right panels) depicting their nuclear expression in low (D3) and high (D7) density cells. Enlarged single-plane (sp) images of Hoechst (blue) or immunofluorescence staining of cells outlined by a white rectangle are also shown below. One of 3 similar experiments is shown. Bar, 15 μm.
