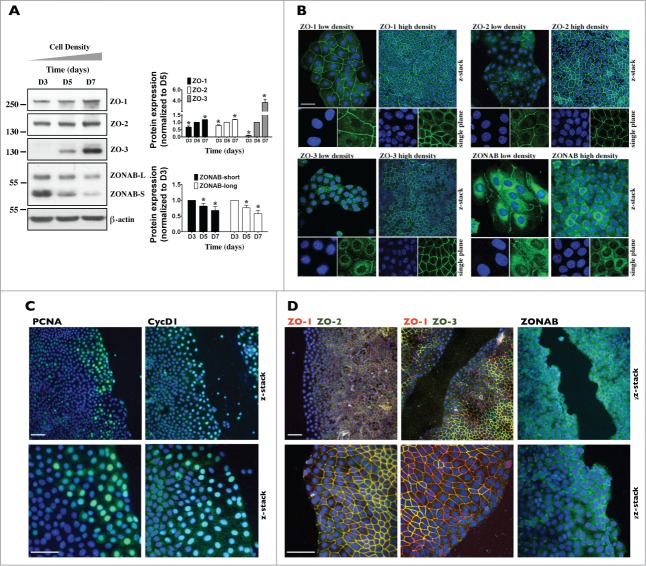
Figure 3.
ZO-3 abundance and expression at junctions is dramatically increased in confluent mCCDcl1 cells. (A) Western blot of ZO-1, ZO-2, ZO-3 and ZONAB 3, 5 and 7 d (D3, D5 and D7) after seeding. β-actin was used as a loading control. Quantification of data, shown at right, is represented as fold difference of protein expression over values obtained at D5 (for ZO proteins) and D3 (for ZONAB) and is expressed as the mean ± SEM of 3 independent experiments. (B) Immunofluorescence of low- and high-density cells. Shown are confocal z-stacks of ZO-1, ZO-2, ZO-3 and ZONAB (all green) depicting their expression at junctional sites (and nuclear expression for ZONAB) in low (D3) and high (D7) density cells. Enlarged single-plane images of Hoechst (blue) or immunofluorescence staining of cells are also shown below. Bar, 10 μm. (C and D) Immunofluorescence of high-density cells 6 h after scratch. Shown are confocal z-stacks of PCNA (green) and CycD1 (green) (C), ZONAB (green) (D) and double-stained confocal z-stacks of ZO-1 (red) / ZO-2 (green) and ZO-1 (red) / ZO-3 (green) (D), depicting their expression at junctional sites (and nuclear expression for PCNA, CycD1 and ZONAB) of cells bordering scratch wounds and of cells located at more distant regions. Enlarged images of Hoechst (blue) or immunofluorescence staining of cells bordering scratch wounds are also shown below. Bar, 30 μm. For (B–D), one of 3 similar experiments is shown.

