Figure 5.
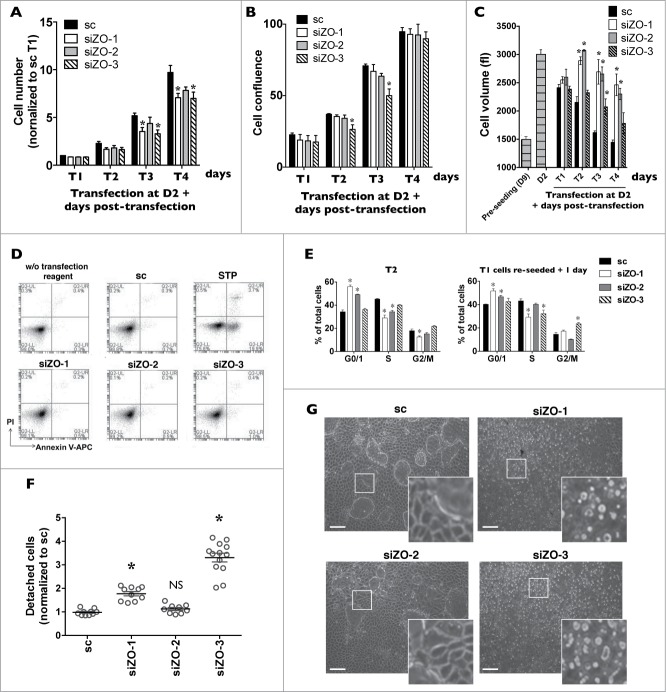
Decreased expression of each ZO protein differently affects mCCDcl1 cell cycle progression and adhesion. (A-C) Cells were transfected 1 day after seeding with scrambled siRNA (sc) or siRNA against ZO-1 (siZO-1), ZO-2 (siZO-2) or ZO-3 (siZO-3) and cell number (A), cell confluence (B) and cell volume (C) were measured 1–4 d post-transfection (T1 - T4). Data is expressed as the mean ± SEM of 4 independent experiments. Cell number is represented as fold difference of siZO data over values obtained in cells transfected with scrambled siRNA at T1. (D) Cell death analysis by flow cytometry of cells transfected with scrambled siRNA or siRNA against ZOs at T3. Staurosporine (STP, 500 nM for 24 h) was used as a positive control for cell apoptosis. (E) Cell cycle analysis by flow cytometry of cells transfected with scrambled siRNA or siRNA against ZOs at T2 (left panel) or of cells exposed to siRNA for 1 day (T1), re-seeded and analyzed 1 day later (right panel). Data is expressed as the mean percentage of G0/G1, S and G2/M phase cells ± SEM of 4 independent experiments. (F) Quantification of cell detachment by flow cytometry of cells transfected with scrambled siRNA or siRNA against ZOs. Data is represented as fold difference of detached cells over values obtained in cells transfected with scrambled siRNA at T2 and is expressed as the mean ± SEM of 5 independent experiments performed in duplicate. NS: no significant difference. (G) Phase-contrast microscopy of high-density cells (T6) illustrating the absence of domes and increased number of detached cells in cells transfected with siZO-1 and siZO-3 as compared to cells transfected with scrambled siRNA or siZO-2. Enlarged images of cells outlined by a white rectangle are shown in inserts. One of 4 similar experiments is shown. Bar, 50 μm.

