
Figure 4. Increased incidence of aneuploidy in oocytes depleted of Sirt6.
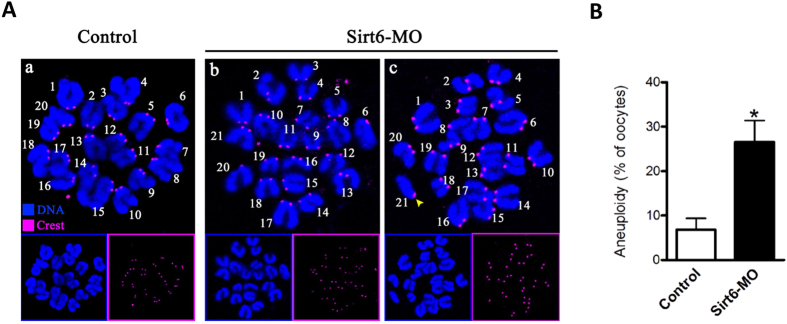
(A) Chromosome spread of control and Sirt6-MO MII oocytes. Chromosomes were stained with Hoechst 33342 (blue) and kinetochores were labeled with CREST (purple). Representative confocal images indicate (a) control oocytes with a normal haploid complement of 20 chromosomes, (b–c) Sirt6-MO oocytes with 21 chromosomes and premature separation of sister chromatids (yellow arrowhead). (B) Histogram showing the incidence of aneuploidy in control and Sirt6-MO oocytes. 50 control oocytes and 52 Sirt6-MO oocytes were analyzed respectively. Error bars indicate ± SD. *p < 0.05 vs. controls.