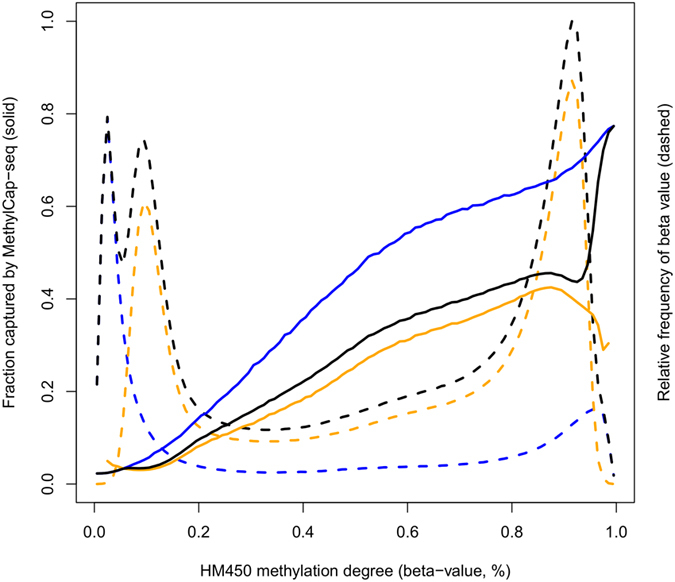
Figure 1. Concordance between MethylCap-seq and HM450 results.

The fraction of fragments captured by MethylCap-seq (solid lines) are plotted as a function of HM450 methylation degrees (beta-values, binned per 1%), for both types of HM450 assays: type 1 (blue), type 2 (orange), and combined (black). The beta-value distributions are depicted as dashed lines for both types individually (type 1, blue; type 2, orange) and combined (black).
