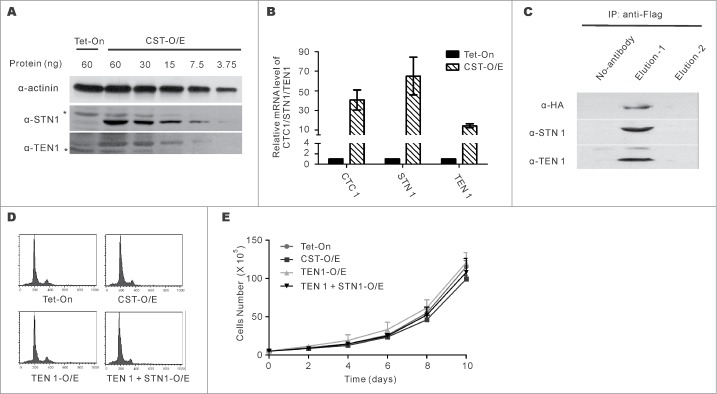
Figure 1.

Characterizing the CST overexpression cell line (CST-O/E). (A) Western blots with STN1 or TEN1 antibody showing levels of over-expression in CST-OE cells relative to Tet-On control. Amount of cell lysate (ng protein) is shown above each lane. *indicates cross-reacting band. (B) RT-qPCR of CTC1, STN1 and TEN1 mRNA levels. Levels are relative to control Tet-On cells with normalization to GAPDH (mean ± SEM, n = 3 experiments). (C) Western blot of FLAG-STN1 immunoprecipitate showing co-purification of HA-CTC1 and TEN1. (D) Analysis of DNA content by FACS shows normal cell cycle profile in CST, TEN1 and TEN1 + STN1 over-expressing cells. (E) Representative growth curves for the indicated cell lines (mean ± SEM, n = 3 experiments). Cells were counted in triplicate for each time point.
