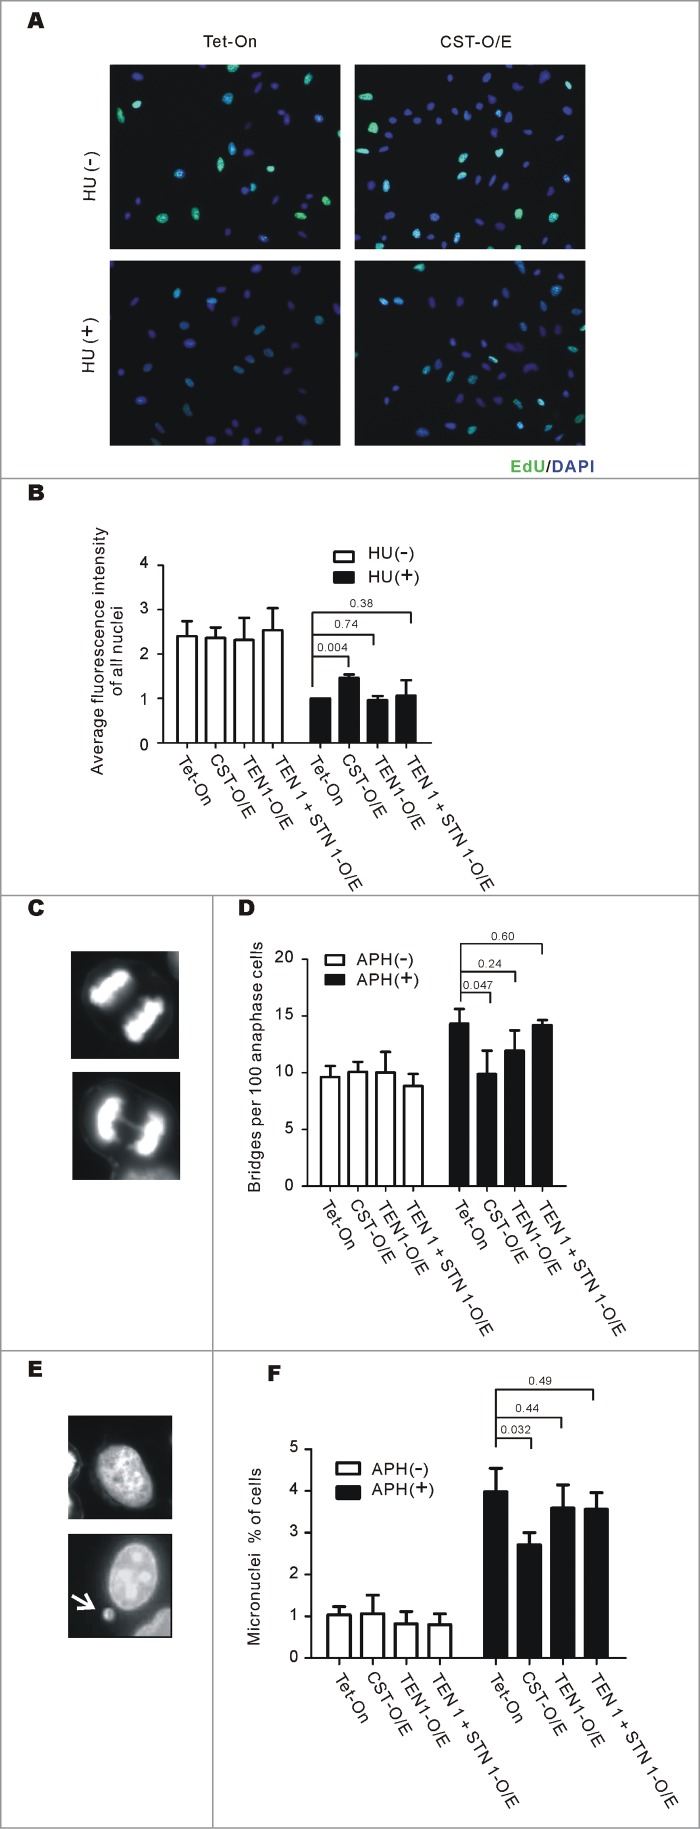
Figure 2.

CST overexpression rescues the effects of replication stress. (A and B) Replication restart after release from HU. CST, TEN1, STN1 + TEN1 over-expressing cells were treated with HU for 2 h, released and then labeled with EdU for 30 min. (A) Images showing EdU uptake. Green, EdU; Blue, DAPI (B) Quantification of EdU uptake. Levels are relative to EdU incorporation by control Tet-On cells after release from HU (mean ± SEM, n = 3 experiments, p-values are indicated). (C-F) Cells were treated with 0.2 mM aphidicolin for 16 h (C and D) or 10 h (E and F) to induce formation of anaphase bridges and micronuclei. (C) Representative images of cells with (bottom) or without (top) anaphase bridges. (D) Quantification of the percentage of anaphase cells with bridges (mean ± SEM, n = 3 experiments, p-values are indicated). (E) Images of cells with (bottom) or without (top) micronuclei. The arrow points to a micronucleus. (F) Quantification of the percent of cells with micronuclei (mean ± SEM, n = 3 experiments, p-values are indicated).
