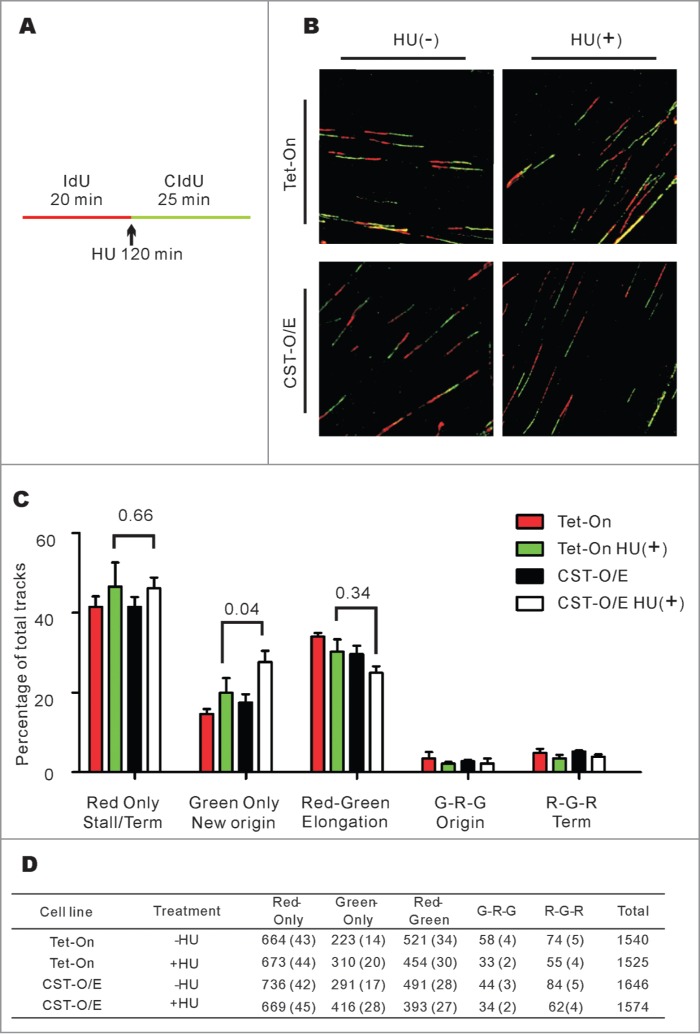
Figure 3.

CST over-expression leads to an increase in new origin firing following release from HU-induced fork stalling. (A) Schematic showing the timing of HU treatment relative to IdU and CldU labeling. (B) Representative images of DNA fibers. Red, IdU; green, CldU. (C) Graph showing the percentage of the indicated types of track (Mean ± SD, n = 3 experiments, p-values are indicated). (D) Total number of tracks scored, number in brackets indicates the percentage of total tracks scored G, Green; R, Red.
