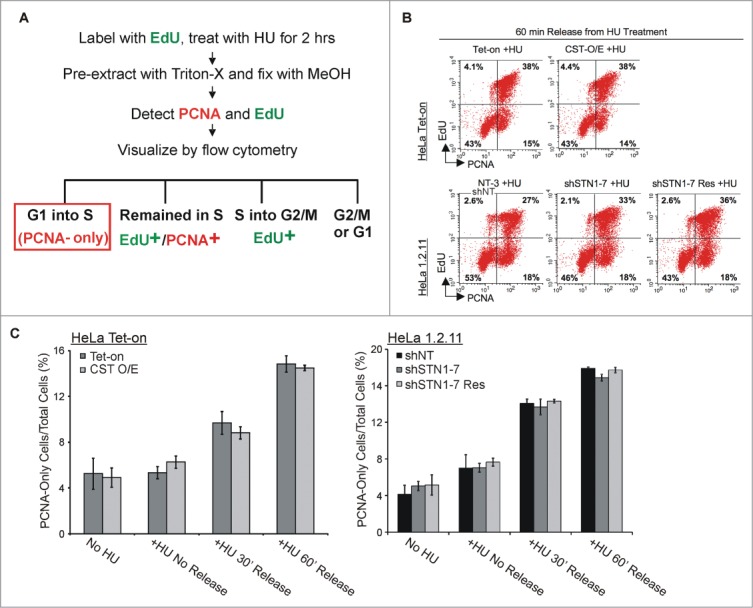
Figure 4.

Alteration in CST abundance does not change cell cycle entry following HU treatment. (A) Schematic showing the experimental design. HeLa Tet-On or HeLa 1.2.11 cells were labeled with EdU, treated with HU for 2 h and then released for 0, 30 or 60 min. Cells not treated with HU were used as a control. EdU and PCNA were then detected to compare the fraction of cells entering S-phase (PCNA-only) relative to cells already in S-phase (PCNA+/EdU+) or just exiting (EdU+) S-phase. (B) Examples of flow cytometry data after 60 min release from HU treatment showing the percent of cells labeled with EdU and/or PCNA. Top: Control and CST overexpressing cell lines (HeLa Tet-On and CST-O/E); Bottom: STN1 depleted (shSTN1–7 clone) and control sh non-target (shNT) and shSTN1 rescue (shSTN1–7 Res) HeLa 1.2.11 cells. Quadrants were created using control cells without EdU or PCNA staining. (C) Graphical representation of the percent of cells entering S-phase (PCNA-only) (mean ± SEM, n ≥ 4 independent experiments).
