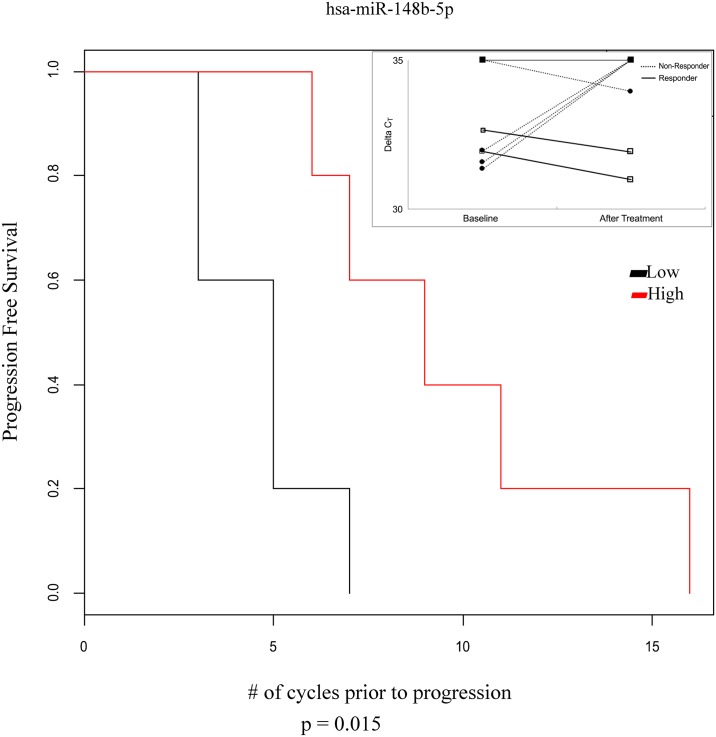
Fig 4. Lower concentrations of miR-148-5p after decitabine/carboplatin chemotherapy compared to baseline predicts worse progression free survival.
For the Kaplan Meier progression free survival curve, patient samples were divided into 2 groups by the median value of the “–delta delta CT” values (post treatment value subtracted from baseline value). The log-rank test was between plasma miRNA concentration (high [red line] vs. low [black line]) with the time to non-response, and p value less than 0.05 was considered significant. The inset plots the raw CT values of all patient samples for miR-148-5p, dashed lines—non-responders, solid lines—responders.

